Operations | Monitoring | ITSM | DevOps | Cloud

Profiling

grafana

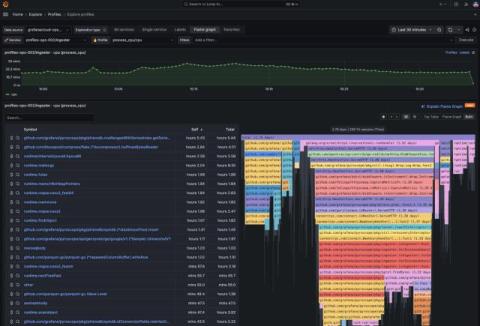
Pyroscope and Grafana Phlare join together to accelerate adoption of continuous profiling, the next pillar of observability

We are happy to announce that Pyroscope, the company behind the eponymous open source continuous profiling project, is now part of Grafana Labs. With this acquisition, we will be merging the Pyroscope project and Grafana Phlare, the project we launched last year, under the new name Grafana Pyroscope. We first met the Pyroscope team, led by co-founders Ryan Perry and Dmitry Filimonov, as they were graduating from Y Combinator. Like Grafana Labs, they have open source in their DNA.

sentry

Profiling Beta for Python and Node.js

A couple months ago, we launched Profiling in alpha for users on Python and Node.js SDKs — today, we’re moving Profiling for Python and Node.js to beta. Profiling is free to use while in beta — more updates to come when we near GA. Profiling is a critical tool for helping catch performance bottlenecks in your code. Sentry’s profiler gets you down to the exact file/line number in your code that is causing a slow-running query.

sentry

Profiling 101: Why profiling?

This is part 2 of a 3-part series on profiling. If you’re not yet familiar with the what profiling is, check out the first part in our series. By this point, you’re probably already convinced that good performance is important for your app’s success. There are many tools available for performance, but profiling in production with a modern profiling tool is one of the easiest and most effective ways to get a full understanding of your app’s performance.

sentry

Profiling 101: What is profiling?

The performance of your app matters. From ensuring a good user experience to retaining users, performance makes a difference in your app’s success. Using the right tools can make it easier to ensure your code is meeting your performance goals, before you have to switch to a bigger EC2 instance or users start complaining. One of the best tools in a developer’s toolbox for ensuring good performance is profiling.

Profiling: Buzzword or Critical Observability Tool? | Snack of the Week

Profiling may seem like the latest buzzword in the monitoring and observability world, but profiling tools have actually been in use for decades. I’m going to quickly explain what profiling is and why modern profilers are getting so much attention lately.
splunk

Optimize Application Performance with Code Profiling

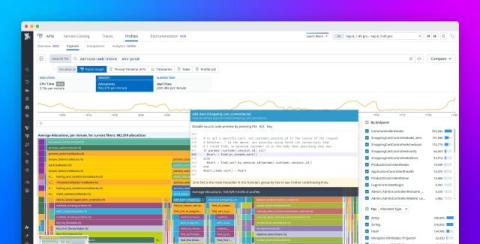
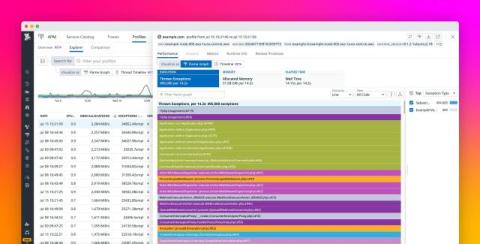
When monitoring your application performance or troubleshooting an issue in production, context is key. The more information available, the faster the prevention of or detection of a user impacting issue. Observability tools offer many different features, like code profiling, to help contextualize your data. In this post, I’ll discuss what code profiling is and show an example of how it works.

elastic

How Universal Profiling unwinds stacks without frame pointers and symbols

Elastic Universal Profiling is based on technology that came into Elastic as part of the acquisition of optimyze.cloud — a startup that had developed Prodfiler.com, the world’s first frictionless fleet-wide in-production multi-runtime profiler that was launched in August 2021. In order to bring the vision of frictionless deployability, low performance overhead, “just run it everywhere” magic to the broader market, a number of technical innovations were necessary.

sentry

Solve code-level bottlenecks with Profiling for Python

Profiling is an important tool in every developer’s toolkit because it provides a granular view into the execution of your program from your production environment. This is an important concept, as performance bottlenecks can often be very hard or even impossible to reproduce locally due to external constraints or loads only seen in a production environment. Python is one of the most popular programming languages available, and it is one of the core technologies we use at Sentry.

sentry

Solve code-level bottlenecks with Profiling for Node.js

Profiling is an important tool in every developer’s toolkit because it provides a granular view into the execution of your program from your production environment. This is an important concept, as performance bottlenecks can often be very hard or even impossible to reproduce locally due to external constraints or loads only seen in a production environment.