Operations | Monitoring | ITSM | DevOps | Cloud

Profiling

Profiling 101: What is profiling?

The performance of your app matters. From ensuring a good user experience to retaining users, performance makes a difference in your app’s success. Using the right tools can make it easier to ensure your code is meeting your performance goals, before you have to switch to a bigger EC2 instance or users start complaining. One of the best tools in a developer’s toolbox for ensuring good performance is profiling.

Profiling: Buzzword or Critical Observability Tool? | Snack of the Week

Profiling may seem like the latest buzzword in the monitoring and observability world, but profiling tools have actually been in use for decades. I’m going to quickly explain what profiling is and why modern profilers are getting so much attention lately.

Optimize Application Performance with Code Profiling

When monitoring your application performance or troubleshooting an issue in production, context is key. The more information available, the faster the prevention of or detection of a user impacting issue. Observability tools offer many different features, like code profiling, to help contextualize your data. In this post, I’ll discuss what code profiling is and show an example of how it works.

How Universal Profiling unwinds stacks without frame pointers and symbols

Elastic Universal Profiling is based on technology that came into Elastic as part of the acquisition of optimyze.cloud — a startup that had developed Prodfiler.com, the world’s first frictionless fleet-wide in-production multi-runtime profiler that was launched in August 2021. In order to bring the vision of frictionless deployability, low performance overhead, “just run it everywhere” magic to the broader market, a number of technical innovations were necessary.

Solve code-level bottlenecks with Profiling for Python

Profiling is an important tool in every developer’s toolkit because it provides a granular view into the execution of your program from your production environment. This is an important concept, as performance bottlenecks can often be very hard or even impossible to reproduce locally due to external constraints or loads only seen in a production environment. Python is one of the most popular programming languages available, and it is one of the core technologies we use at Sentry.

Solve code-level bottlenecks with Profiling for Node.js

Profiling is an important tool in every developer’s toolkit because it provides a granular view into the execution of your program from your production environment. This is an important concept, as performance bottlenecks can often be very hard or even impossible to reproduce locally due to external constraints or loads only seen in a production environment.

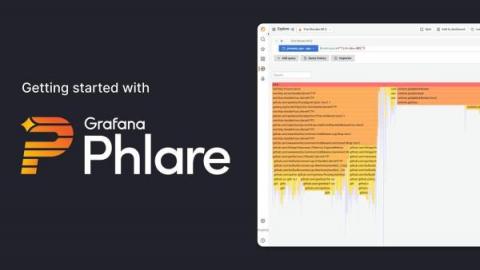
Watch: How to get started with Grafana Phlare for continuous profiling

A big piece of news to come out of ObservabilityCON in early November was the launch of Grafana Phlare. Phlare is an open source, horizontally scalable, highly available, multi-tenant continuous profiling aggregation system. Continuous profiling has been dubbed the fourth pillar of observability, after metrics, logs, and traces. The idea behind Phlare was sparked during a company-wide hackathon at Grafana Labs.

Building a Performant iOS Profiler

Profilers measure the performance of a program at runtime by adding instrumentation to collect information about the frequency and duration of function calls. They are crucial tools for understanding the real-world performance characteristics of code and are often the first step in optimizing a program. Apple and Google have first party profiling tools, but they are only usable for local debugging during development.

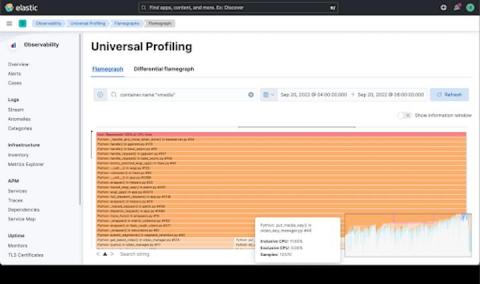
Elastic Universal Profiling helps you deliver fast, affordable, and efficient services

So, what is Universal Profiling™? Universal Profiling™ is fast emerging as an important component of observability. A standard feature inside hyperscalers since approximately 2010, the technology is slowly percolating into the wider industry. Universal Profiling™ allows you to see what your code is doing all the time, in production across a wide range of languages and can profile both user-space and kernel-space code.