Operations | Monitoring | ITSM | DevOps | Cloud

Profiling

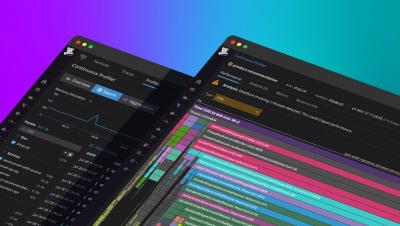
Analyze Ruby code performance with Datadog Continuous Profiler

Ruby is an object-oriented programming language celebrated for its simple and easy-to-read syntax. It powers Ruby on Rails, the open source web development framework that streamlines common development tasks involved in building web applications. We’re pleased to announce that our Continuous Profiler, which provides low-overhead, code-level performance insights, is now generally available for Ruby applications.

Announcing the Preview of Splunk APM's AlwaysOn Profiling

For application developers and service owners who build and troubleshoot modern enterprise software, resolving production issues requires identifying poor performance across multiple networks, operating systems, servers, configs, and third party dependencies. When the problem is the code itself, code profiling helps identify service bottlenecks by periodically taking CPU snapshots, or call stacks, from a runtime environment.

Compare and optimize your code with Datadog Profile Comparison

Code profilers offer detailed insight into the efficiency of application code by measuring things like the execution time and resource utilization of a service. Datadog’s always-on, low overhead Continuous Profiler provides snapshots of code performance for a service that are tagged with key metadata (e.g., region, service, release), so you can easily identify and optimize inefficient code.

How to Troubleshoot Performance with a Visual Studio Profiler

Performance profilers mainly aid developers in analyzing the performance of applications. The purpose is to improve poorly performing sections of code that make up the functions of the application. When you say performance profilers, common names that come to mind are Visual Studio performance profilers and Prefix by Netreo. In this article, we will focus on the specific Visual Studio profiling tools for memory and CPU usage.

Optimized: Using A JavaScript (JS) Profiler For Improved Performance

No matter what you’re coding, there’s always room to optimize your code and improve performance. This can be a painstaking process, and if you’re going over your code line by line you’d better cancel all your plans and forget about getting any sleep! Fortunately, there are better ways to examine and optimize your code. A JS profiler is an efficient tool to help you understand your code better – effectively finding, pinpointing and optimizing bottlenecks in your code.

What is the best way to profile a Java application in eclipse

Java profiling in Eclipse allows you to optimize your code, streamline your application, and better understand your program. When profiling your application using a line-level analysis, you can reveal the slowest line within a sluggish piece of code, helping you efficiently troubleshoot problems. There are a variety of platforms for profiling Java eclipse. Eclipse is a popular software and is especially valuable for beginners due to its clean interface and free and open-source background.

Why Python cProfile is the Recommended Profiling Interface

Performance optimization is a basic need for software development. When it comes to optimizing app performance, tracking frequency, maintaining production, or perpetuation method calls, profilers play a vital role. Learn why Python cProfile is a recommended profiling interface and how it enhances your software performance.

How to Choose the Best Performance Profiling Tools

You finish writing your code and launch your application. Then, you begin experiencing performance issues. How can you fix this? It doesn’t matter how talented your development team is, every code should always be analyzed, debugged, and reviewed to make it run faster. What you need is a performance profiling tool. In this article, you will learn about performance profiling and how to determine the best performance profiling tools for your software.

How Mercari reduced request latency by 15% with Cloud Profiler

The events of 2020 have accelerated ecommerce, increasing demand for and traffic on online marketplaces. Analyst eMarketer predicts that ecommerce sales in the United States will grow 18% in 2020, against an overall fall in total retail sales of 10.5% for the year. Likewise, our business—Japan-headquartered consumer-to-consumer marketplace Mercari Inc—is growing rapidly. In the United States alone, we have seen 74% year-on-year growth in monthly average users to 3.4 million.