Operations | Monitoring | ITSM | DevOps | Cloud
%term
PagerDuty Incident Response Training (Summit Series Chicago 2017)
Celebrating Our Launch!!
ActiveMQ architecture and key metrics
Apache ActiveMQ is message-oriented middleware (MOM), a category of software that sends messages between applications. Using standards-based, asynchronous communication, ActiveMQ allows loose coupling of the elements in an IT environment, which is often foundational to enterprise messaging and distributed applications.
Collecting ActiveMQ metrics
In Part 1 of this series, we looked at how ActiveMQ works, and the key metrics you can monitor to ensure proper performance of your messaging infrastructure. In this post, we’ll show you some of the tools that you can use to collect ActiveMQ metrics. This includes tools that ship with ActiveMQ, and some other tools that make use of Java Management Extensions (JMX) to monitor ActiveMQ brokers and destinations.
Monitoring ActiveMQ with Datadog
As you operate and scale ActiveMQ, comprehensive monitoring will enable you to rapidly identify any bottlenecks and maintain the flow of data through your applications. Earlier in this series, we introduced some key ActiveMQ metrics to watch, and looked at some tools you can use to monitor ActiveMQ.
SolarWinds Adds SDN Monitoring Support to Industry-Leading Network Management Portfolio
How to Diagnose and Fix AWS Lambda Iterator Age
AWS Lambda can use stream based services as invocation sources, essentially making your Lambda function a consumer of those streams. Stream sources include Kinesis Streams and DynamoDB streams. When you allow streams to invoke your Lambda function, Lambda will emit a CloudWatch metric called IteratorAge. In this post, we discuss what this metric is and how to fix it if it’s too high.
Streamlined Kubernetes Cluster Agent
Sematext provides a single pane of glass and machine learning powered alerts for logs, metrics, traces and digital user experience data. The new Sematext agent is fully Docker Engine and Kubernetes-aware. (Re)written in Go, it has a minimal memory and CPU footprint. It also collects Kubernetes metrics in the most optimal fashion possible.
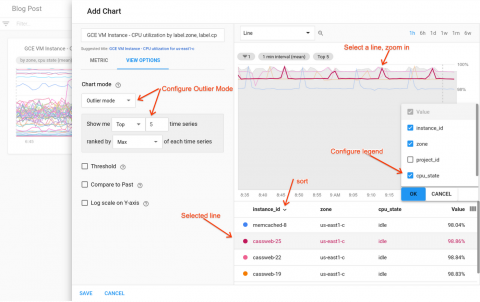
Stackdriver tips and tricks: Understanding metrics and building charts
Seeing what’s going on with your IT infrastructure, applications and services has always been critical to the success of modern businesses’ day-to-day operations. Google Stackdriver monitoring provides out-of-the-box visualizations and insights for Google Cloud Platform (GCP) users so you can easily understand your systems.


