Operations | Monitoring | ITSM | DevOps | Cloud

SolarWinds

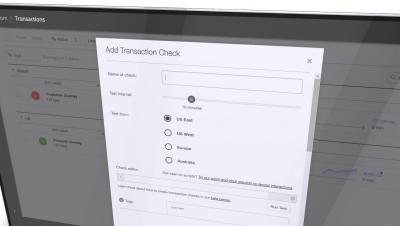
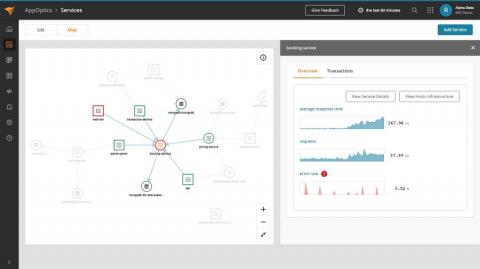
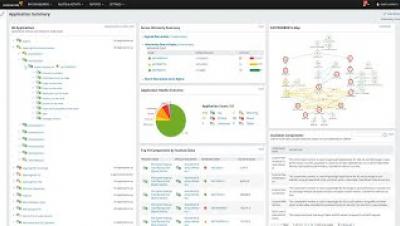
SolarWinds Updates APM Suite Designed to Simplify Application and Infrastructure Management

Introduces new service map and web transaction recorder, enhanced custom parsing rules, and search user experience to further reduce application performance management complexity and speed up troubleshooting.

So, You Inherited Orion

So, you’ve inherited a SolarWinds Orion environment! Do you feel disoriented or like you’ve landed on the island of misfit engineers? Think again. Over 50% of the respondents to a recent survey indicate they’re in the exact same situation as you! In this session, SolarWinds Head Geek™ Leon Adato joins members of the SolarWinds UX team for a roundtable discussion of common questions, like “Should I just start over?” and “How do I make a so-so implementation better?”

Four Strategies for Securing the Tactical Edge

The military has invested significant time and money implementing edge computing on the battlefield. The Army’s efforts to leverage the tactical cloud to process data on the edge gets information into soldiers’ hands more quickly, allowing them to make decisions in near-real time. But these benefits come with significant challenges, particularly regarding security. The more endpoints, the larger the potential attack surface and the greater the risk.

5 Best Tools to Tail Logs in 2020

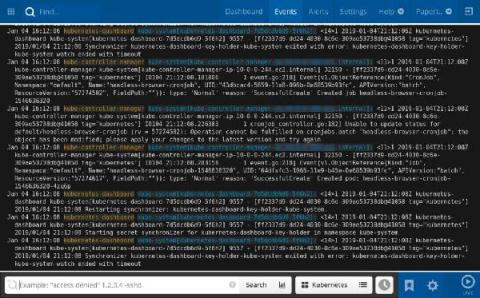
Modern businesses rely on a complex ecosystem of digital networks, databases, applications, user devices, and more. The tools and platforms supporting this ecosystem undergo constant refinement and upgrades. However, the basic methods for monitoring infrastructure and application performance have remained unchanged, and logging is one such methods. Every computer, server, networking device, and application produces logs, a timestamped record of events within a system.

5 Best Tools to Tail Logs

Modern businesses rely on a complex ecosystem of digital networks, databases, applications, user devices, and more. The tools and platforms supporting this ecosystem undergo constant refinement and upgrades. However, the basic methods for monitoring infrastructure and application performance have remained unchanged, and logging is one such methods. Every computer, server, networking device, and application produces logs, a timestamped record of events within a system.

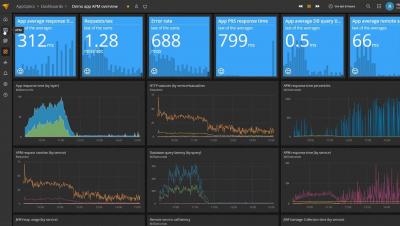
Application Performance Monitoring With SolarWinds AppOptics

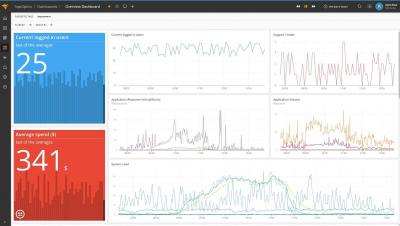
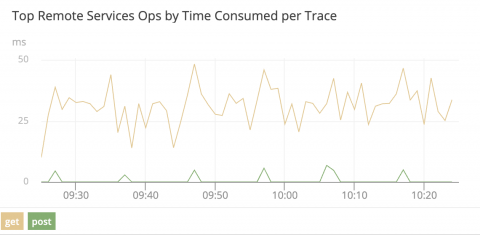
AppOptics provides real-time visibility into any application by collecting both high-fidelity metrics and detailed transaction traces. Follow requests across processes, hosts, and data center with the distributed tracing functionality—no manual instrumentation required Quickly jump from visualizing trends to deep, code-level root cause analysis, and easily monitor applications across many different programming languages including: .NET, Java, Scala, Python, and PHP.