Operations | Monitoring | ITSM | DevOps | Cloud

SolarWinds

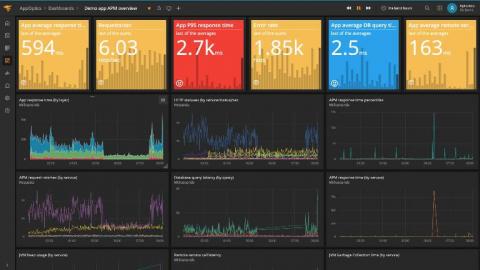
The Cost of NOT Monitoring Every Application

If you’ve been building or supporting applications for a while, you’ve probably experienced the uncomfortable postmortem meetings that inevitably follow significant service interruptions. You know how it works. There was a critical outage in one of your apps and it took the team an entire week to track down and fix the issue. Customers and revenue were lost. Now you’re sitting in a large conference room with executives to discuss what happened and why.

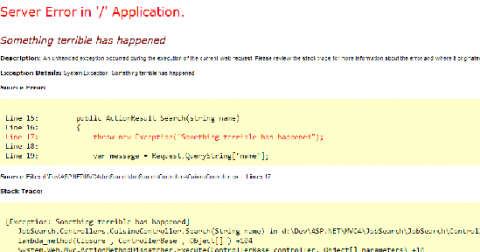
How to Extract Actionable Intelligence With C# Logging

When applications are deployed in the production environment, developers expect them to work smoothly without any performance issues. However, applications often experience unexpected bottlenecks, making it crucial to monitor applications. One of the simplest ways to monitor a C# application is to emit, save, and index log data for search, analysis, and troubleshooting. We’ll discuss how you can monitor your applications while making the most of C# logging.

An Exploration of Runtime Metrics: Node's Event Loop

What Are Runtime Metrics? Runtime metrics can help us understand how an application is performing. SolarWinds® AppOptics™, a SaaS-based, full-stack infrastructure and application monitoring tool, now reports four categories of runtime metrics: CPU, memory, garbage collection times, and event loop times. Each metric category provides a view into how resources are used by an application.

The Expensive History of APM

When done well, application performance monitoring (APM) is a magical and irreplaceable tool. However, over the years, enterprises have sometimes paid dearly to implement it. APM’s task seems simple enough—replace emotional user anecdotes about application performance with quantifiable, actionable data. But the devil can certainly be in the details with APM.

Page Load Time vs. Response Time - What Is the Difference?

Page load time and response time are key metrics to monitor, and they can give you an in-depth understanding of how your website is performing. However, the difference between page load time and response time isn’t immediately obvious, and neither are the benefits of tracking them independently.

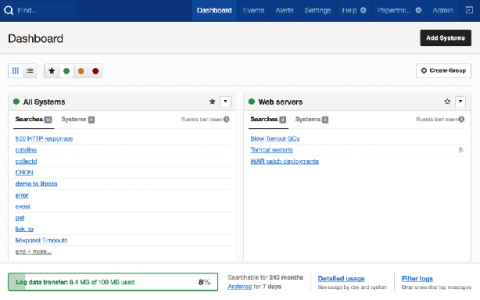
5 Benefits of Cloud-Based Log Aggregation Tools

In the modern digital ecosystem, every user activity, system error, application transaction, and network packet movement can be tracked using logs. This level of visibility into systems, networks, and applications is useful for troubleshooting bottlenecks, analyzing past trends, and predicting future events. However, monitoring various cloud-based and on-premises resources becomes complex in the absence of proper log aggregation tools.

SolarWinds Study Shows Converged Roles and Contracting Budgets Increase Need for Qualified U.K. Tech Pros Across Hybrid IT Environments

SolarWinds IT Trends Report 2020: The Universal Language of IT examines the evolving role of technology in business and the breakdown of traditional IT siloes. Less than 25% of budgets dedicated to emerging tech, instead prioritise cloud and hybrid IT. Tech pros cite need to upskill across security, APM, and non-technical and interpersonal skills.

5 Reasons You Should Start Analyzing Your Logs

In IT environments, all software applications and systems produce logs with varying levels of details or context about different events. These log files are automatically generated, and you can see them as a time-stamped record of events. Traditionally, organizations maintained logs locally or in a self-hosted setup. This was done primarily to meet various compliance mandates.