Operations | Monitoring | ITSM | DevOps | Cloud
%term
Monitoring AWS Lambda with Instrumental
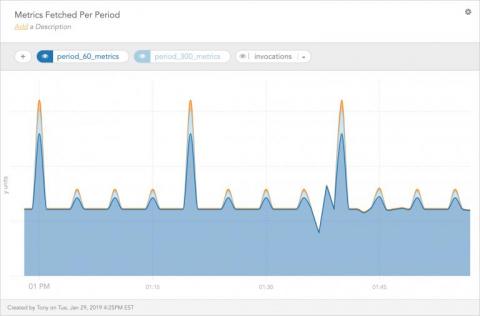
We recently launched our CloudWatch integration, which brings your CloudWatch data into the same monitoring environment as your application metrics, service metrics, and uptime monitoring. Most of our infrastructure is in AWS, so this is a great feature for us; hopefully you’ll like it too!
Mattermost 5.12.1 released
Mattermost dot release 5.12.1 for Team Edition (TE) and Enterprise Edition (EE) is now available for download. If your deployment is affected by issues this dot release fixes, upgrading is recommended. Otherwise, you can upgrade to the next monthly release which also includes these fixes. This version resolves the following bugs in the Mattermost 5.12 release:
What's New in Pandora FMS 7.0 NG 736
In Pandora FMS release 736 we have been working on visual improvements of the interface, optimizing the view of events and services.
AWS Lambda - 7 things you might not know
In the unlikely event that you might not already hear this, AWS Lambda is Amazon’s answer to the serverless computing. The theory behind serverless computer services is, as it sounds, to create a network for a variety of purposes while bypassing the need to have and maintain expensive servers. With AWS Lambda, you are at top of the class in serverless computing. The setup and management is a breeze.
Announcing Flare: Make opening incidents stress free
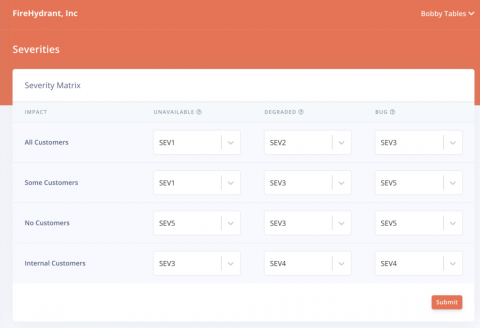
We’re launching a new feature today that allows anyone in your organization to kick off your incident response process with an appropriate severity level attached from Slack. Often people are afraid to open an incident or even share that they’re aware of something going wrong with your applications. When everything is important, nothing is important; users frequently overestimate the impact of an incident and assign an inappropriately high severity level.
Python Geocoder: A Guide to Managing Locations in Your Apps
A great thing about building applications for the internet is that people from all around the world can benefit from your effort. You can gather new users from Taiwan to Colorado and meet their needs just as effectively. In this global context, it can be good to provide your users with local flavor to help them feel connected to you and your applications. It can also be useful for you to know where your users are coming from to make sure that your infrastructure is configured in the best way.
5 Ways to Optimise Your Site for Mobile
Every year, more and more website traffic is mobile-driven. Statistically speaking, you’re far more likely to be reading this article now on a mobile device rather than on desktop. Indeed, mobile usage goes far beyond website traffic, as virtually every action we take in modern life, from ordering a takeaway to sharing a photo with friends, takes place on a mobile device.
Bridge24: interactive charts for Asana and Trello
Businesses of all sizes are taking advantage of how project management can help their company stay competitive and grow. Incidentally, online project management software has become more accessible and affordable today with cloud technology and software-as-a-service. PM tools like Asana and Trello provide companies a centralized platform for managing tasks, tracking projects, and generating reports. /p>
Diagnose Xamarin.Forms errors, crashes and performance issues with ease
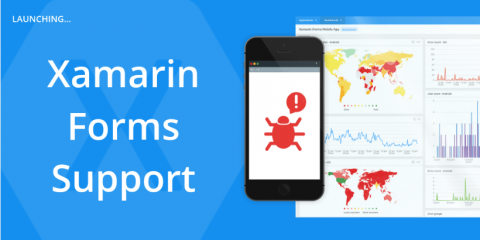
Software quality is vital to user experience. If your users are experiencing problems with your mobile app, you simply need to know about it. That’s why today, we’re announcing our new Raygun4XamarinForms provider for Crash Reporting and Real User Monitoring.


