Operations | Monitoring | ITSM | DevOps | Cloud
%term
Creating Custom Kibana Visualizations
As you may very well know, Kibana currently has almost 20 different visualization types to choose from. This gives you a wide array of options to slice and dice your logs and metrics, and yet there are some cases where you might want to go beyond what is provided in these different visualizations and develop your own kind of visualization.
Server monitoring software | Pandora FMS
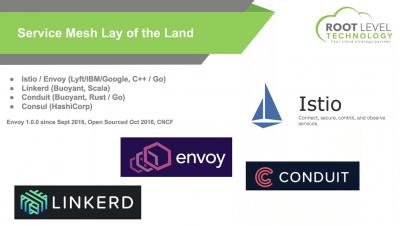
Kubernetes Master Class: Bringing Istio to Production
(Third) Party Planning: Be careful who you invite!
From a customer’s point of view, your website’s digital experience is one of the most important investments you can make for them. They are your revenue stream, your fiercest critic and the reason you exist. One great way you can improve your digital experience is by using third-party providers. Many of these providers will help you win more business, provide cool features, gather better data and much more.
Announcing Intelligent Application and Service Monitoring for VxRail
SolarWinds Updates Network Management Portfolio to Deliver Expanded Flexibility, Scalability, and Visibility Across Complex Environments
A Kibana Tutorial: Getting Started
Kibana is the visualization layer of the ELK Stack — the world’s most popular log analysis platform which is comprised of Elasticsearch, Logstash, and Kibana. This tutorial will guide you through some of the basic steps for getting started with Kibana — installing Kibana, defining your first index pattern, and running searches. Examples are provided throughout, as well as tips and best practices.
Cut yourself some Slack: Team collaboration through OpManager-Slack integration
Besides email, IT teams need a flexible communication platform that facilitates fast and easy collaboration. Slack is one such tool, as it helps internal teams collaborate and make decisions quickly. OpManager now integrates with Slack, enabling you to discuss issues related to your network on a more agile platform, and collaborate with team members to troubleshoot network issues.


