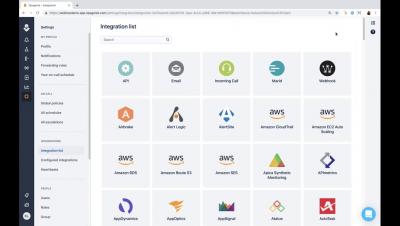
New UI-Introduction to Opsgenie -April 24th
Get an overview of Opsgenie in the brand new UI and learn how our modern alerting and incident management platform improves how quickly and effectively Dev and Ops teams respond to issues.


So you have a Grafana dashboard that shows failures at 0.01% and that latency is down throughout the company. But rather than get a pat on the back, “your boss’s boss is saying cut the crap or stop the mumbo jumbo. What does it really mean for our business?” said Peter Zaitsev, CEO of Percona, which offers solutions such as support, management services, consultant training, and custom engineering for MySQL, MariaDB, MongoDB, Postgres and other open source databases.
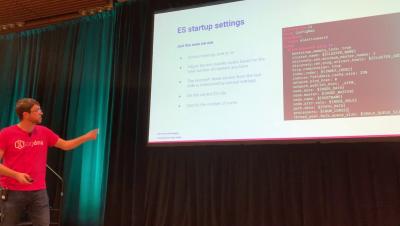
Last month, AWS announced an initiative called Open Distro for Elasticsearch. Since then, there has been a lot of debate as to what this move means for the future of the ELK Stack and the community. What are the motives behind this move? Does this split actually signify a fork?
Today we launched a new open source project called k3OS. K3OS is a Linux distro built for the sole purpose of running Kubernetes clusters. In fact, it is a Linux distro and the k3s Kubernetes distro in one! As soon as you boot up a k3OS node, you have Kubernetes up and running. When you boot up multiple k3OS nodes, they form a Kubernetes cluster. K3OS is perhaps the easiest way to stand up Kubernetes clusters on any server.
In this tutorial we are going to learn how to instrument Java code to expose application metrics using JMX monitoring. Following the code examples, you can monitor the availability, health and performance of your Java application. Java 1.5 introduced JMX – Java Management eXtensions – which is a standard way to instrument code in the JRE world.
The Trade Desk provides a self-service, cloud-based platform for buyers of online advertising. Since its founding in 2009, TTD has grown into a publicly traded company with more than 900 employees and a market cap of $8.89 billion. The company recently moved from an old monitoring system based on Nagios, Graphite, and a number of homegrown pieces of software, to something more standard, based on Prometheus.