Operations | Monitoring | ITSM | DevOps | Cloud

%term

Log Management Comparison: ELK vs Graylog

Production logs can help ensure application security, reveal business insights and find and understand errors, crashes, and exceptions. But as useful as logs are, they’re difficult to manage and hard to keep track of. Making matters worse is that as log data volume grows, so does the difficult task of maintaining and managing them. It’s for this reason that developers, DevOps engineers, and CTOs turn to log management tools.

Using AI analytics to detect real-time application issues

Anodot’s Solutions Engineer and AI specialist, Steven Kirkpatrick, presents how leading gaming companies are leveraging the powerful anomaly detection capabilities of Anodot’s AI Analytics to proactively address business incidents in real time, minimizing revenue loss and identifying opportunities.

5 Critical Reasons for Network Traffic Analysis

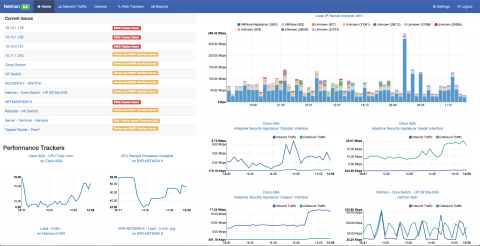
As communication and network infrastructure grows in size and complexity, having a complete view and understanding of your network environment (including the amount and type of network traffic going back and forth) becomes vital to your business’ health and operations. Having the right tools to do the job is just as important. If you can’t quickly determine the source, destination, rate and the type of traffic going across the network, you don’t have the right tool.

Monitoring with Azure and Grafana

What is whitebox monitoring? Why do we monitor our systems? What is the Azure Monitor plugin and how can I use it to monitor my Azure resources? Recently, I spoke at Swetugg 2018, a .NET conference held in Stockholm, Sweden to answer these questions. In this video you’ll learn some basic monitoring principles, some of the tools we use to monitor our systems, and get an inside look at the new Azure Monitor plugin for Grafana.