Operations | Monitoring | ITSM | DevOps | Cloud

%term

How to Visualize Data that Really Matters to Business with Grafana and MySQL

So you have a Grafana dashboard that shows failures at 0.01% and that latency is down throughout the company. But rather than get a pat on the back, “your boss’s boss is saying cut the crap or stop the mumbo jumbo. What does it really mean for our business?” said Peter Zaitsev, CEO of Percona, which offers solutions such as support, management services, consultant training, and custom engineering for MySQL, MariaDB, MongoDB, Postgres and other open source databases.

Key Insights From Forrester Research on Containers and Microservices

In our previous post about containers and microservices, we covered the challenges of monitoring these new technologies as well as how you can use software-defined IT operations tools to overcome them. The recently released Forrester Research report, Monitoring Containerized Microservices?

New S3 Objects give 403 Forbidden in Cloudfront

A common problem with Amazon CloudFront and Amazon S3 hosting deals with negative TTLs. Matthew from Blue Matador outlines the steps needed to correct this problem. Understand eventual consistency in S3. New items may take time to propagate through redundant systems and be available in all locations., Understand CloudFront's default policy for handling errors, like 403 forbidden, is to cache that error for 5 minutes., The solution is to modify distribution settings in CloudFront.

Announcing k3OS: A Kubernetes Operating System

Today we launched a new open source project called k3OS. K3OS is a Linux distro built for the sole purpose of running Kubernetes clusters. In fact, it is a Linux distro and the k3s Kubernetes distro in one! As soon as you boot up a k3OS node, you have Kubernetes up and running. When you boot up multiple k3OS nodes, they form a Kubernetes cluster. K3OS is perhaps the easiest way to stand up Kubernetes clusters on any server.

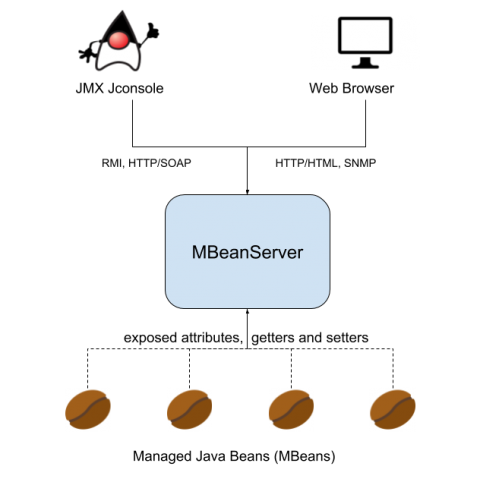
JMX monitoring + Java custom metrics.

In this tutorial we are going to learn how to instrument Java code to expose application metrics using JMX monitoring. Following the code examples, you can monitor the availability, health and performance of your Java application. Java 1.5 introduced JMX – Java Management eXtensions – which is a standard way to instrument code in the JRE world.

The Trade Desk: Lessons We Learned Migrating from Homegrown Monitoring to Prometheus

The Trade Desk provides a self-service, cloud-based platform for buyers of online advertising. Since its founding in 2009, TTD has grown into a publicly traded company with more than 900 employees and a market cap of $8.89 billion. The company recently moved from an old monitoring system based on Nagios, Graphite, and a number of homegrown pieces of software, to something more standard, based on Prometheus.

Is Parkinson's Law threatening your team's projects?

Think about the last time you worked on a large group project. Go ahead — let out that inevitable groan. Now, think about the last time you worked on a group project that was completed ahead of schedule. Yep, we hear those crickets too. Team projects are notorious for taking far more time than expected, which means you don’t have to go far to find some famous examples.