Operations | Monitoring | ITSM | DevOps | Cloud

%term

New Release: Squared Up 4.1 is here!

Squared Up 4.1 just landed. And what better way to start this announcement than the promise of more feature releases?! It’s been seven months since Squared Up 4.0, but the hard work put in by the development team since then has set us up for a bright, feature-rich future. All those juicy performance improvements and platform changes mean, moving forward, you can expect a new feature release from us every two to three months.

Fantastic Data Breaches and How to Prevent Them Event

Named in the top 10 world’s most dangerous people alongside Trump & Putin, we are all under attack from Magecart. They attack websites, digital platforms & e-commerce 3rd party supply chains to steal our data, selling it to the highest bidder on the dark web. Our aim is to increase awareness on Magecart attacks, therefore we’ve created an event for Leeds Digital Festival.

Logging Kubernetes on GKE with the ELK Stack and Logz.io

An important element of operating Kubernetes is monitoring. Hosted Kubernetes services simplify the deployment and management of clusters, but the task of setting up logging and monitoring is mostly up to us. Yes, Kubernetes offer built-in monitoring plumbing, making it easier to ship logs to either Stackdriver or the ELK Stack, but these two endpoints, as well as the data pipeline itself, still need to be set up and configured.

How to Monitor Amazon Elastic Load Balancing with CloudWatch

Amazon Elastic Load Balancing ( ELB ) allows you to create load balancers for your application without having to actually manage the servers that do the load balancing. However, since it’s a managed service, you have less visibility with traditional monitoring tools. As such, it becomes even more important to take advantage of the available monitoring tools in AWS. In this post, we’ll explain how to use CloudWatch to monitor Elastic Load Balancing and what is important to watch.

Monitoring StatsD: metric types, format & code examples

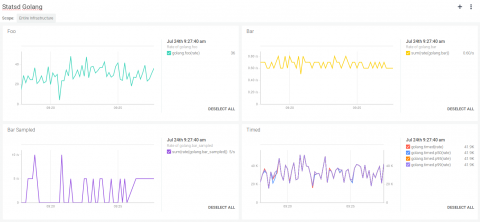
The StatsD stack is one of the most popular monitoring solutions to instrument your code using custom metrics. In this post we will describe the StatsD metrics architecture, metrics types and formats, proving code examples for the Golang, NodeJS/Javascript and Python programming languages.