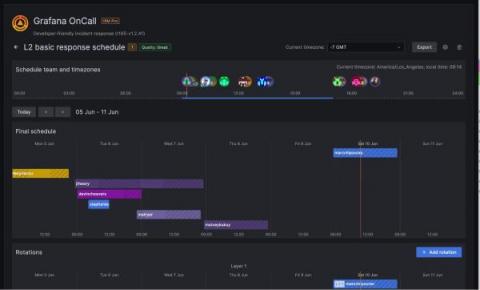
Does anyone really enjoy being on-call? That looming dread over what could go wrong? The alarms in the middle of the night when everything does in fact go wrong? Of course not! But that doesn’t mean on-call shifts need to be a giant bundle of anxiety and exhaustion. This is something near and dear to our hearts at Grafana Labs, since the majority of our engineers participate in on-call shifts.

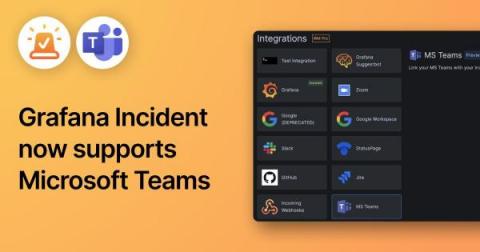
Grafana Incident, the powerful incident response tool that is part of the Grafana IRM suite in Grafana Cloud, comes with a range of integrations out of the box, including Zoom and Google Meet spaces, GitHub and JIRA issues, and even a Google Doc template for post-incident review documents. One of the key features in Grafana Incident is the chatbot integration, which previously only supported Slack.
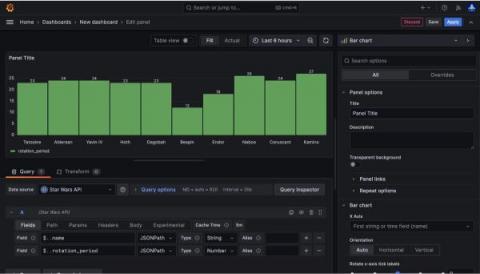
Have you ever wanted to test out Grafana Cloud but don’t have any available data to monitor? Well, have no fear! With the Grafana JSON API plugin, you can query publicly available JSON endpoints. The JSON API is a wonderful way to start using Grafana Cloud. You can quickly see data in action, and there are a multitude of things you can build, analyze, and monitor using the JSON API.
When we launched Pyroscope in 2021, we had one clear goal: Give developers a powerful open source continuous profiling tool for collecting, storing, and analyzing profiling data. Grafana Labs had a similar goal when they released Grafana Phlare, a horizontally scalable, highly available open source profiling solution inspired by databases like Grafana Loki, Grafana Mimir, and Grafana Tempo.
If you’re using AWS, you’re almost certainly using Amazon CloudWatch to collect and analyze observability data from your favorite AWS services. And while AWS remains the most broadly adopted cloud platform, not every company uses it exclusively, which means you need a tool that gives a centralized view across all your environments. With Grafana Cloud, you can do just that.
As you’d imagine, generative AI has been a huge topic here at Grafana Labs. We’re excited about its potential role in bridging the gap between people and the beyond-human scale of observability data we work with every day. We’ve also been talking a lot about where open source fits in — especially if that Google researcher is right and OSS will outcompete OpenAI and friends. What role can we play to bring the community along?
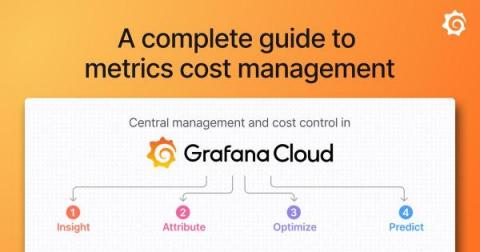
The macro economy can put a lot of pressure on organizations to reduce costs, typically with the central SRE and platform engineering teams coming under scrutiny. One common workaround we’ve seen countless teams make is compromising their observability by ingesting fewer metrics in the name of cost savings. But for centralized SRE/observability teams, the response to macro conditions should not be monitor less, but rather monitor smarter.
Grafana 10.1 is here! The latest Grafana release introduces new features and improvements that help deepen your observability insights in Grafana, including an improved flame graph, a new geomap network layer, simplified alerting workflows, and more. Grafana 10.1: Download now! For an overview of all the features in this release, check out our What’s New documentation. And to learn the details about all the Grafana 10.1 updates, read our changelog for more information.
Grafana k6 v0.46.0 is here! The new release features the ability to configure TLS, new usage reports and PDF reports in Grafana Cloud, and tons of improvements for Grafana k6 OSS and Grafana Cloud k6. Here’s an overview of Grafana k6 v0.46.0, as well as some other important updates from the k6 team and community.
Grafana Loki is an open source logs database built on object storage services in the cloud. These services are an essential component in enabling Loki to scale to tremendous levels. However, like all SaaS products, object storage services have their limits — and we started to crash into those limits in Grafana Cloud Logs, our SaaS offering of Grafana Loki.
Over the past six months, we have been working on optimizing query performance in Grafana Mimir, the open source TSDB for long-term metrics storage. First, we tackled most of the out-of-memory errors in the Mimir store-gateway component by streaming results, as we discussed in a previous blog post. We also wrote about how we eliminated mmap from the store-gateway and as a result, health check timeouts largely disappeared.
Victor Sonck is a Developer Advocate for ClearML, an open source platform for Machine Learning Operations (MLOps). MLOps platforms facilitate the deployment and management of machine learning models in production. As most machine learning engineers can attest, ML model serving in production is hard. But one way to make it easier is to connect your model serving engine with the rest of your MLOps stack, and then use Grafana to monitor model predictions and speed.
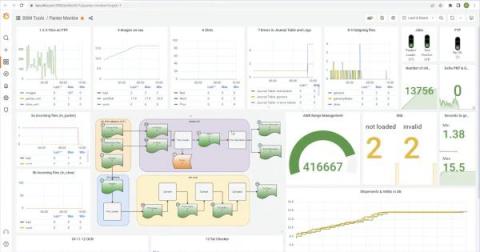
Each year, more than 296 million packages are shipped around the world via DHL and their premium service, Time Definite International. And at DHL Express Switzerland, a local unit of the international logistics and shipping company, the IT team provides solutions for tracking customs clearance progress, analytics, mobile and optical character recognition (OCR) scanning, and warehouse management on every package that moves through Switzerland.
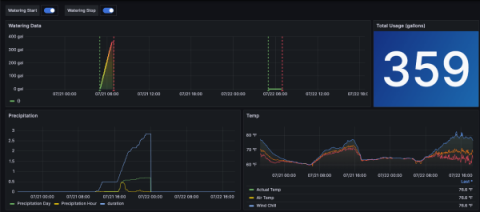
I’ve had a swimming pool at my house in Massachusetts since 2016. One of the problems that pool owners like myself face when we go on vacation or leave for several days is evaporation from the pool and the water level dropping below the skimmers. This can happen due to sunlight and warm temperatures. It can also happen when temperatures drop at night and the pool is being heated — the water temperature is warmer than the air, causing the water to evaporate.
Christophe is a self-taught engineer from France who specializes in site reliability engineering. He spends most of his time building systems with open-source technologies. In his free time, Christophe enjoys traveling and discovering new cultures, but he would also settle for a good book by the pool with a lemon sorbet.
Grafana k6 is a powerful, developer-friendly tool designed and engineered with a focus on load testing — but it boasts capabilities that extend far beyond that use case. Understanding the inner workings of k6 is helpful to fully leverage its potential, and to tailor the tool to your specific testing needs. Read on to learn how k6 is structured, and how its underlying design provides the best possible reliability and load testing experience.
Observability has traditionally been conceptualized in terms of three core facets: logs, metrics, and traces. For years, these elements have been seen as the “pillars” of observability, serving as the foundational components for system monitoring and delivering key insights to improve system performance. However, with the exponential growth in system complexity, a more comprehensive and unified perspective on observability has become necessary.
At Grafana Labs, we are constantly improving our feature set, and tracing is no different. Traces are often overshadowed by logs and metrics, but they’re a pillar of observability for a reason. Used correctly, organizations that can quickly and successfully follow a chain of events through a system gain a more holistic view of their systems and are better equipped to find and fix issues faster.
One of the most talked about topics in observability today is centered around the question of how to get more value out of the ever-increasing amount of data collected by agents, collectors, scrapers, and the like. Back in May, we announced Adaptive Metrics, a new feature in Grafana Cloud that allows you to reduce the cardinality of Prometheus metrics and the overall volume and costs of your metrics.
With Grafana 10, the latest major release of our data visualization platform, we wanted to explore new ways to empower our developer community. Case in point: Grafana Scenes, a new frontend library that enables developers to create dashboard-like experiences — such as querying and transformations, dynamic panel rendering, and time ranges — directly within their Grafana application plugins.
Get excited about Grafana Tempo 2.2! Not only is this release on time, but it is also chock full of TraceQL features and performance improvements. I was honestly a little shocked by how much we have accomplished in the last three months when summarizing the changelog.
It’s no secret that anyone can download our open source software and run it, because — once more with feeling — open source is in our DNA. But it can be hard to set up and configure a whole stack from scratch, which is why we offer Grafana Cloud as a fully managed observability platform.