Operations | Monitoring | ITSM | DevOps | Cloud
September 2023
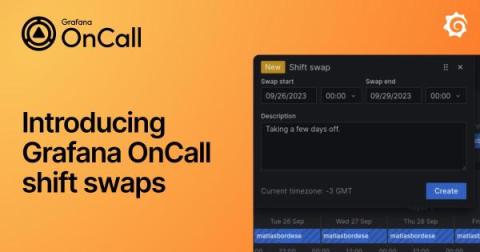
Introducing Grafana OnCall shift swaps: A simpler way to exchange on-call shifts with teammates
A family member’s birthday, that concert you’ve waited all year to see, an impromptu weekend getaway with friends — there are a lot of reasons software engineers might want to switch on-call shifts. And rather than have to frantically send Slack messages to your teammates, wouldn’t it be nice to automate the process and quickly find the coverage you need?
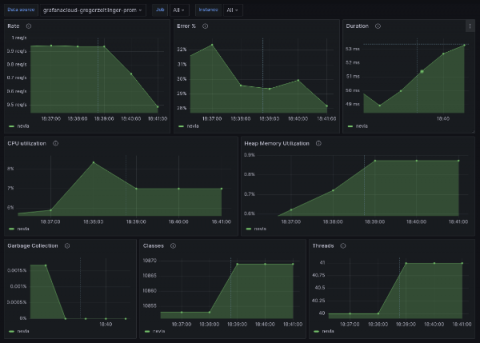
Introducing the Prometheus Java client 1.0.0
PromCon, the annual Prometheus community conference, is around the corner, and this year I’ll have exciting news to share from the Prometheus Java community: The highly anticipated 1.0.0 version of the Prometheus Java client library is here! At Grafana Labs, we’re big proponents of Prometheus. And as a maintainer of the Prometheus Java client library, I highly appreciate the support, as it helps us to drive innovation in the Prometheus community.
OpenTelemetry metrics: A guide to Delta vs. Cumulative temporality trade-offs
In OpenTelemetry metrics, there are two temporalities, Delta and Cumulative and the OpenTelemetry community has a good guide on the different trade-offs of each. However, the guide tackles the problem from the SDK end. It does not cover the complexity that arises from the collection pipeline. This post takes that into account and covers the architecture and considerations that are involved end-to-end for picking the temporality.
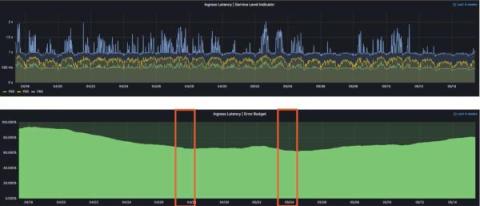
How to monitor SLOs with Grafana, Grafana Loki, Prometheus, and Pyrra: Inside the Daimler Truck observability stack
In order for fleet managers at Daimler Truck to manage the day-to-day operations of their vast connected vehicles service, they use tb.lx, a digital product studio that delivers near real-time data along with valuable insights for their networks of trucks and buses around the world. Each connected vehicle utilizes the cTP, an installed piece of technology that generates a small mountain of telemetry data, including speed, GPS position, acceleration values, braking force and more.
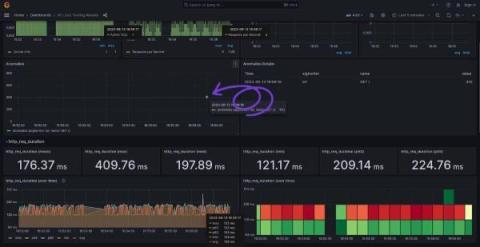
Better anomaly detection in system observability and performance testing with Grafana k6
Grzegorz Piechnik is a performance engineer who runs his own blog, creates YouTube videos, and develops open source tools. He is also a k6 Champion. You can follow him here. From the beginning of my career in IT, I was taught to automate every repeatable aspect of my work. When it came to performance testing and system observability, there was always one thing that bothered me: the lack of automation. When I entered projects, I encountered either technological barriers or budgetary constraints.
Loki Log Context Query Editor in Grafana 10
Learning in public: How to speed up your learning and benefit the OSS community, too
Technical folks in OSS communities often find themselves in permanent learning mode. Technology changes constantly, which means learning new things — whether it’s a new feature in the latest OSS release or an emerging industry best practice — is, for many of us, simply a natural part of our jobs. This is why it’s important to think about how we learn, and improve the skill of learning itself.
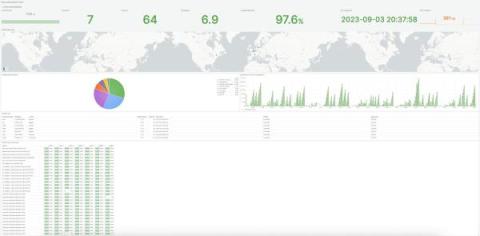
How universities preserve and protect digital assets with Grafana dashboards
Anthony Leroy has been a software engineer at the Libraries of the Université libre de Bruxelles (Belgium) since 2011. He is in charge of the digitization infrastructure and the digital preservation program of the University Libraries. He coordinates the activities of the SAFE distributed preservation network, an international LOCKSS network operated by seven partner universities.
Grafana 10.1: Introducing the geomap network layer
Improved time series, trend, and state timeline visualizations in Grafana 10.1
Grafana 10.1: How to build dashboards with visualizations and widgets
New flame graph features for continuous profiling data in Grafana 10.1
How to to filter trace spans in Grafana 10.1
Grafana 10.1: TraceQL query results streaming
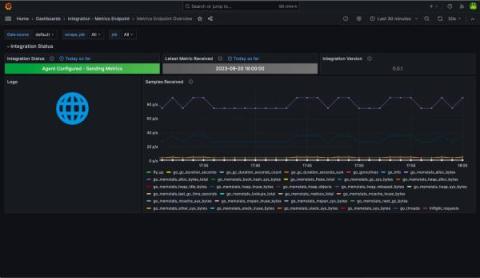
Introducing agentless monitoring for Prometheus in Grafana Cloud
We’re excited to announce the Metrics Endpoint integration, our agentless solution for bringing your Prometheus metrics into Grafana Cloud from any compatible endpoint on the internet. Grafana Cloud solutions provide a seamless observability experience for your infrastructure. Engineers get out-of-the-box dashboards, rules, and alerts they can use to visualize what is important and get notified when things need attention.
How to create an alert rule in Grafana 10.1
Troubleshoot failed performance tests faster with Distributed Tracing in Grafana Cloud k6
Performance testing plays a critical role in application reliability. It enables developers and engineering teams to catch issues before they reach production or impact the end-user experience. Understanding performance test results and acting on them, however, has always been a challenge. This is due to the visibility gap between the black-box data from performance testing and the internal white-box data of the system being tested.
How to correlate performance testing and distributed tracing in Grafana Cloud k6
A better Grafana OnCall: Delivering on features for users at scale
Enterprise IT is just a different animal. Whether it’s operating at scale, undertaking massive migrations, working across scores of teams, or addressing tight security requirements, engineers at these organizations can face different obstacles than their counterparts at smaller organizations and startups.
Inside Prezi's cost-saving switch to Grafana Alerting, Grafana OnCall, and Grafana Incident from PagerDuty
Alexander is Senior SRE at Prezi, a video and visual communications software company. As a team, the Prezi SREs provide multiple services within the company. One of those is the observability stack where Prezi heavily relies on Grafana. Companies are always evolving to run more smoothly, serve their customers better, and operate in a way that is cost-effective.
Announcing Sift: automated system checks for faster incident response times in Grafana Cloud
When faced with an incident, there are two areas that demand your immediate attention: the incident investigation, and the cross-functional coordination needed to resolve the issue. Grafana Incident helps with the collaboration by providing a central hub for communication across teams that seamlessly integrates with the tools you are already using, such as Slack or Microsoft Teams. But how can you best use your telemetry data to debug your application and bring your systems back online?
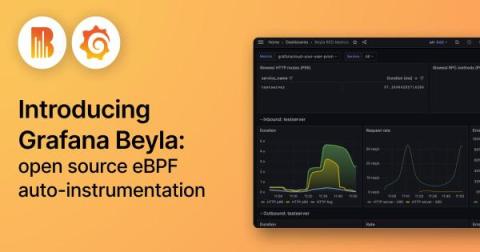
Introducing Grafana Beyla: open source ebpf auto-instrumentation for application observability
Do you want to try Grafana for application observability but don’t have time to adapt your application for it? Often, to properly instrument an app, you have to add a language agent to the deployment or package. And, in languages like Go, proper instrumentation means manually adding tracepoints. Either way, you have to redeploy to your staging or production environment once you’ve added the instrumentation.
Modernizing government documents with Govable and Grafana (Grafana Office Hours #12)
Grafana Scenes is generally available: start building highly interactive apps today
Grafana Scenes is a frontend library that allows you to effortlessly extend Grafana, enabling capabilities that were once deemed unattainable, or exceedingly challenging, for Grafana app plugin developers. We first introduced Grafana Scenes with the launch of Grafana 10 at GrafanaCON 2023. Now, after 3 months in private preview, we are excited to announce that we are graduating Grafana Scenes to general availability.
How to provision a notification policy in Grafana Alerting - and keep it editable in the UI
Provisioning Grafana Alerting resources, such as notification policies, can help you deploy resources faster and streamline the alerting and notification process. Before getting started, it’s important to understand the different options for provisioning notification policies, how they work, and the challenges they can present. In Grafana Alerting, notification policies use alert labels to determine how alerts are routed to different contact points or receivers.
Grafana Loki hits 20K GitHub stars: 20 fun facts about the open source logging project
The Grafana Loki GitHub repository just hit 20K stars! You can’t exchange GitHub stars for coffee at Starbucks or pay rent with it, but this is a big milestone that is a testament to the enormous momentum of this open source project. Thank you to the Grafana Loki community — this couldn’t have been possible without you! To celebrate this 20K benchmark, here are 20 completely random, but fun facts and tips about Grafana Loki: Interested in learning more about logging?
Grafana k6 for WebSockets and infrastructure testing (Grafana Office Hours #11)
Celebrating 100 episodes of k6 Office Hours (k6 Office Hours #100)
Why "good reply game" matters in open source communities
Communities of all sorts, including open source communities, boil down to the daily interactions we have with one another. What we call “the community” emerges from a series of utterances and responses, which gives rise to relationships and networks. This makes “good reply game” essential to create, sustain, and grow an open source community.
How to use the Grafana Faro Web SDK with Grafana Cloud Frontend Observability to gain additional app insights
Frontend observability (or real user monitoring) is a critical, yet often overlooked, part of systems monitoring. Website and mobile app frontends are just as complex, if not more so, than the backend systems observability teams typically prioritize. They also represent the first interaction users have with our applications — so it’s important to have full visibility into that experience.
Grafana Loki 2.9 release: TSDB volume endpoints, remote rule evaluations, LogQL optimizations
The Loki squad is excited to announce Grafana Loki 2.9 is here! For this release, we’ve developed additional TSDB endpoints to help you better understand your log volume; introduced query language optimizations to make parsing more performant; and restructured our documentation so it is easier to use. This coincides with the release of Grafana Enterprise Logs (GEL) 1.8, so all the features discussed here are available in both Loki 2.9 and GEL 1.8.
Simplify observability with the Grafana OpenTelemetry Starter and Spring Boot 3
To help simplify instrumenting Spring Boot applications with Grafana Cloud, we are excited to introduce the Grafana OpenTelemetry Starter, a project that connects the latest Micrometer enhancements from Spring Boot 3 with Grafana Cloud using OpenTelemetry. By using these tools, you will have logs, metrics, and traces in a single service — in the same easy way that you can use Prometheus with Spring Boot.
What makes a good open source community?
Whenever you use open source software, you benefit from the community that surrounds it — whether it’s a bug fix, better documentation, a helpful tutorial or something else. We at Grafana Labs benefit from the open source community, too: from your participation, and the many OSS components we use in the development of Grafana itself. But what makes an open source community successful, exactly? And how do you build and nurture one?


