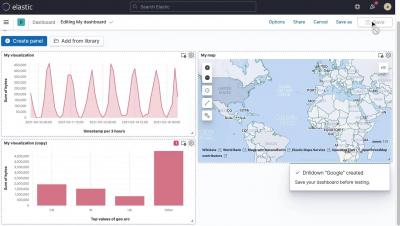
Today we’re excited to introduce the Kubernetes integration for Grafana Cloud, our composable observability platform bringing together metrics, logs, and traces with Grafana. Grafana Cloud users can now easily monitor and alert on core Kubernetes cluster metrics using the Grafana Agent, our lightweight observability data collector optimized for sending metric, log, and trace data to Grafana Cloud.
Today’s business demands that IT transform from a cost center to an innovation engine. To foster a business mindset, IT leaders need full visibility into operations so they can achieve desired business outcomes. At ServiceNow, we run IT like a business to deliver value quickly, improve productivity, and create great user experiences. The CIO Dashboard is one of the capabilities our IT leadership uses daily to advance business outcomes that help us scale.
Greetings! This is Abdelkrim from the Solutions Engineering team, and I am with Sriram from the Enterprise Plugin team. We both joined Grafana Labs in February this year, and we already have some stories to share with you. I came to Grafana Labs from a big data and analytics background, and I witnessed a lot of companies storing monitoring and performance data in all kinds of analytics platforms (data lakes, data warehouses, cloud, etc.).
We’ve seen how much you love SquaredUp. But we’re also aware that opening up access to your SCOM and Azure data can sometimes hold you back from sharing the joy of powerful dashboarding with other teams. And what about trying to get an overview of multiple SCOM management groups without having to log into each one individually? We have the perfect solution for both problems.
Grafana Explore makes correlating metrics and logs easy. Prometheus queries are automatically transformed into Loki queries . And we will be extending this feature in Grafana 8.0 to support smooth logs correlation not only from Prometheus, but also from Graphite metrics. Prometheus and Loki have almost the same query syntax, so transforming between them is very natural. However, Graphite syntax for queries is different, and in order to map it to Loki, some extra setup is required.
Template variables enable you to use tags to filter your Datadog dashboards to the hosts, containers, or services you need for faster troubleshooting. However, there are some cases where it may be difficult to use a standard set of template variables to aggregate all of the data you need without creating a complicated, difficult to manage set of variables. For example, you may use tag values that are a subset of another tag.
For many years, it has been possible to scale Cortex clusters to hundreds of replicas. The relatively simple Dynamo-style replication relies on quorum consistency for reads and writes. But as such, more than a single replica failure can lead to an outage for all tenants. Shuffle sharding solves that issue by automatically picking a random “replica set” for each tenant, allowing you to isolate tenants and reduce the chance of an outage.
I’ll come clean and admit it – this part of the series will be a bit interesting given the fact that I know very little about Elasticsearch. So really, this is an honest test of the question – “can I still build something good with Dashboard Server even if I only have nominal knowledge of the tool where the data is sourced from?”