Dashboards

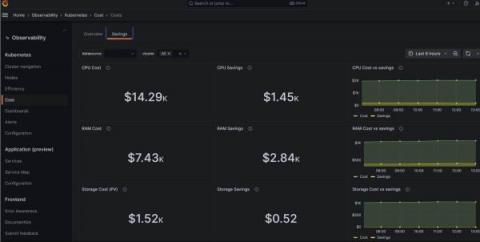
Rein in spending with Kubernetes cost monitoring in Grafana Cloud

As your Kubernetes infrastructure — and your business — grows, so too does the headache of managing your stack. And since controlling costs is crucial for your organization’s well-being, you need visibility into your complex system to ensure you’re spending your money wisely. That’s why we’re excited to introduce Kubernetes cost monitoring as a new feature in Grafana Cloud.

How to monitor an Apache CouchDB cluster with Grafana Cloud

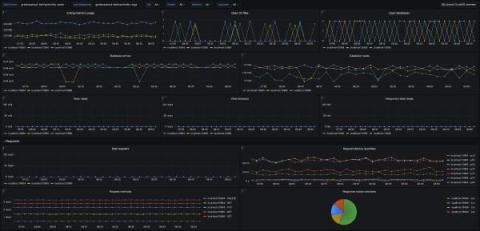
We’re excited to introduce a dedicated Grafana Cloud integration for Apache CouchDB, a NoSQL document database that stores data in a JSON-based document format. Known for its scalability, availability, and easy replication of data across multiple servers, Apache CouchDB comes with a whole host of features designed to make it easy to run resilient distributed systems, with built-in bi-direcitonal replication allowing for simple replication across multiple servers and data centers.

Dashboard Fridays: Home Solar Power Monitoring dashboard

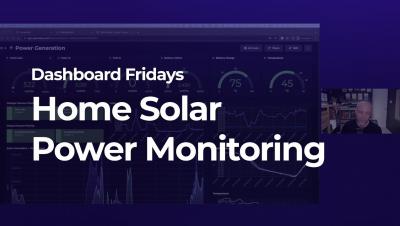
In our latest Dashboard Fridays episode, Adam Kinniburgh showcases his Home Solar Power Monitoring dashboard built using SquaredUp and Amazon Timestream. This dashboard tracks the home energy system, which is monitored using Solar Assistant running on a Raspberry Pi in Adams garage. It shows how much solar power is being generated, how much energy is stored in the batteries, how much energy he's using, plus other metrics.

New in Grafana 10: Securely monitor and query network-secured data sources from Grafana Cloud

Grafana is designed to visualize data in beautiful dashboards, no matter where the information lives. However, if you are considering the hosted Grafana Cloud observability stack for visualizing your data, you might run into a roadblock: network security. The problem is that some data sources, like MySQL databases or Elasticsearch clusters, are hosted within private networks.

A User Guide for OpenSearch Dashboards

Over the last decade, log management has been largely dominated by the ELK Stack – a once-open source tool set that collects, processes, stores and analyzes log data. The ‘k’ in the ELK Stack represents Kibana, which is the component engineers use to query and visualize their log data stored in Elasticsearch. Sadly, in January 2021, Elastic decided to close source the ELK Stack, and as a result, OpenSearch was launched by AWS as an open source replacement.

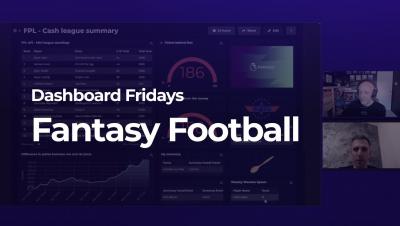
Dashboard Fridays: Fantasy Premier League Football Dashboard with Web API

This Fantasy Football dashboard shows the Cash League (league with cash prizes) and Tim's performance in it, so he can always see where he is in relation to first place. Tim decided it was time to put SquaredUp to work on his personal passion and build a dashboard that allows him to consume the information at a glance. All the data is pulled from the FPL Web API and includes monitoring to get the colors to show whether he's doing well or not.

Icinga Kubernetes Helm Charts

Before attending Icinga Berlin in May this year, Daniel Bodky and Markus Opolka from our partner NETWAYS developed the very first Icinga Kubernetes Helm Charts and released it in an alpha version. If you have ever wanted to deploy an entire Icinga stack in your Kubernetes cluster, now is your chance. I also want to highlight Daniel’s talk again on how Icinga can run on Kubernetes and the challenges involved.