Operations | Monitoring | ITSM | DevOps | Cloud

IoT

Bulk Issue Merge Functionality | Memfault Feature Highlights

Previously, merging issues on Memfault's platform was a manual process. As the number of issues increased, the process became more time-consuming. To make it easier, we've introduced new bulk issue merge functionality. This functionality lets you select a software type and use filters to limit the list of issues. You can then either bulk-select all issues or be specific about which ones you choose.

A Modern C Development Environment

Sometimes, C/C++ projects have a long development cycle. When working on such a project, it can be easy to take our development environment for granted, and forget about the effort invested in its bring-up. The build environment works like magic, the test framework is neatly integrated, and the CI/CD pipeline relieves us of tedious, repetitive tasks.

Best tools for monitoring IoT devices

The security camera is one of the most prevalent IoT devices being used today. Ironically, one of these cameras' primary vulnerabilities is that they may be stolen or damaged - you need protection for the security cameras. Having gadgets that operate independently saves time since you may leave them to do the job they intended. However, remotely placed, unsupervised equipment must be monitored, and the most effective method is through the use of an automated monitoring system.

IoT Dashboards with Grafana and Prometheus

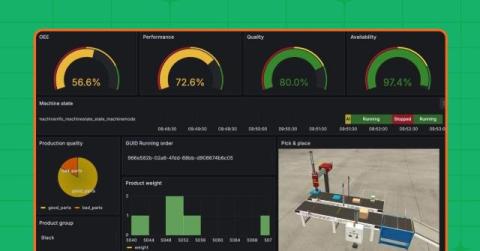
The Internet of Things (IoT) - is a number of physical devices connected to one network that enables the system to interact with the external world. A great deal of the work surrounding IoT is monitoring, as it’s impossible to react without knowing the situation. For example, we might build a greenhouse system for agriculture that can maintain optimal conditions for growing crops. For this purpose, we need to have sensors picking up information about the temperature and humidity.

Employing Coredumps to Debug Your Embedded Devices

Memfault knows firsthand how difficult identifying and solving the root causes of firmware faults can be, particularly for devices in the field. Local debugging and logging subsystems are commonly used to determine the issue cause, however, these tools are limited and invasive. This is where coredumps become helpful! Coredumps, an underutilized debugging resource, can provide valuable insights as they contain highly structured data that can be easily parsed.

Understanding Battery Performance of IoT Devices

I’ve been a firmware engineer at two wearable companies in the past, Pebble and Fitbit, and there was always one class of customer support tickets and user complaints that never went away: issues around battery life. It was a constant game of whack-a-mole with every new firmware version introducing a battery regression.

Azure IoT: Enabling the Future of Connectivity

As we stand on the brink of the fourth industrial revolution, the Internet of Things (IoT) has emerged as a key player in this brave new world. It’s akin to a jigsaw puzzle, providing the bits and pieces that, when properly assembled, can give rise to a complete and holistic picture of our digitized environment. At the heart of this transformation lies Microsoft’s Azure IoT, a comprehensive suite of services and solutions tailored to unlock the full potential of IoT.

Enhancements to Alerting and Notification Functionality in Memfault

In this video, I will be discussing the new enhancements that we have made to the alerting and notification functionality within Memfault. These enhancements include configurable incident start and end delays, the ability to decide when your team receives notifications during an incident, and increased control over the scheduling of incident summary notifications. Our goal is to reduce noise without sacrificing visibility, giving users greater control over notification and alerting behaviors. Watch this video to learn how to take advantage of these new features and improve your monitoring experience.

Feature Highlight Rollup by Cohort or by Software Version

In this video, I will be showcasing our newly released metric chart type called "Rollup by Cohort or by Software Version." This chart type provides an overtime view of your metric performance, allowing you to compare between software versions or cohorts. Unlike the existing chart types, which have an eight-week time window limitation, this new view enables absolute comparisons of performance across software versions. I will demonstrate how to make performance comparisons and explain the benefits of using this chart type. If you have any questions, please reach out to our team.