Operations | Monitoring | ITSM | DevOps | Cloud

Latest Posts

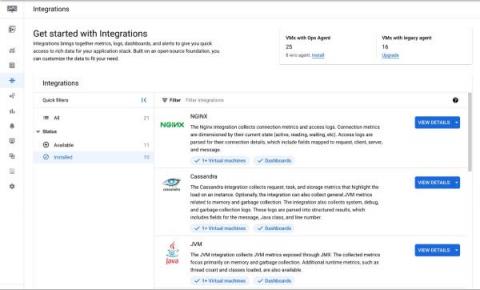
Application observability made easier for Compute Engine

When IT operators and architects begin their journey with Google Cloud, Day 0 observability needs tend to focus on infrastructure and aim to address questions about resource needs, a plan for scaling, and similar considerations. During this phase, developers and DevOps engineers also make a plan for how to get deep observability into the performance of third-party and open-source applications running on their Compute Engine VMs.

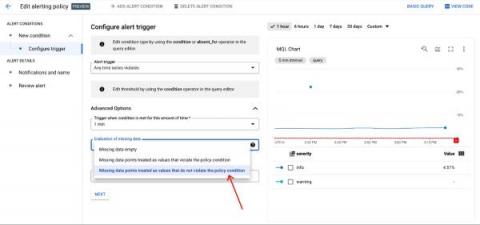
Add severity levels to your alert policies in Cloud Monitoring

When you are dealing with a situation that fires a bevy of alerts, do you instinctively know which alerts are the most pressing? Severity levels are an important concept in alerting to aid you and your team in properly assessing which notifications should be prioritized. You can use these levels to focus on the issues deemed most critical for your operations and triage through the noise.

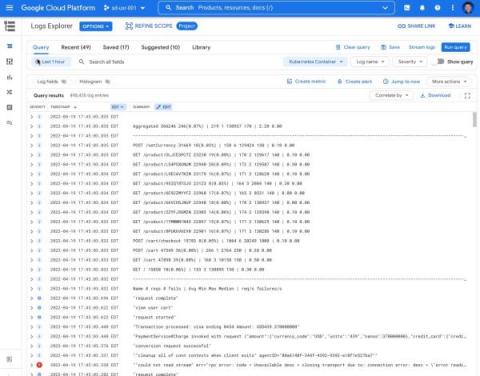
Get more insights from your Java applications logs

Today it is even easier to capture logs in your Java applications. Developers can get more data with their application logs using a new version of the Cloud Logging client library for Java. The library populates the current executing context implicitly with every ingested log entry. Read this if you want to learn how to get HTTP requests and tracing information and additional metadata in your logs without writing a single line of code.

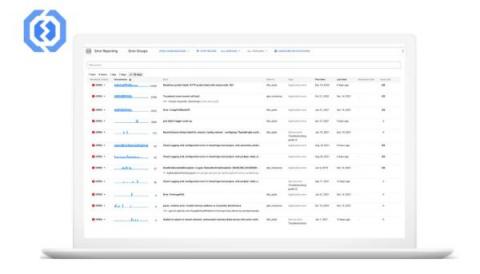
Quickly troubleshoot application errors with Error Reporting

Are you familiar with the four golden signals of Site Reliability Engineering (SRE): latency, traffic, errors, and saturation? Whether you’re a developer or an operator, you’ve likely been responsible for collecting, storing, or analyzing the data associated with these concepts. Much of this data is captured in application and infrastructure logs, which provide a rich history of what is happening behind the scenes in your workloads.

Getting Started with Google Cloud Logging Python v3.0.0

We’re excited to announce the release of a major update to the Google Cloud Python logging library. v3.0.0 makes it even easier for Python developers to send and read logs from Google Cloud, providing real-time insights into what is happening in your application. If you’re a Python developer working with Google Cloud, now is a great time to try out Cloud Logging! If you're unfamiliar with the `google-cloud-logging` library, getting started is simple.

Webhook, Pub/Sub, and Slack Alerting notification channels launched

When an alert fires from your applications, your team needs to know as soon as possible to mitigate any user-facing issues. Customers with complex operating environments rely on incident management or related services to organize and coordinate their responses to issues. They need the flexibility to route alert notifications to platforms or services in the formats that they can accept.

Creating custom notifications with Cloud Monitoring and Cloud Run

The uniqueness of each organization in the enterprise IT space creates interesting challenges in how they need to handle alerts. With many commercial tools in the IT Service Management (ITSM) market, and lots of custom internal tools, we equip teams with tools that are both flexible and powerful. This post is for Google Cloud customers who want to deliver Cloud Monitoring alert notifications to third-party services that don’t have supported notification channels.

Patterns for better insights and troubleshooting with hybrid cloud logs

Hybrid and multi-cloud environments produce a boundless array of logs including application and server logs, logs related to cloud services, APIs, orchestrators, gateways and just about anything else running in the environment. Due to this high volume, logging systems may become slow and unmanageable when you urgently need them to troubleshoot an issue, and even harder to use them to get insights.

How to deploy the Google Cloud Ops Agent with Ansible

Site Reliability Engineering (SRE) and Operations teams responsible for operating virtual machines (VMs) are always looking for ways to provide a more reliable, more scalable environment for their development partners. Part of providing that stable experience is having telemetry data (metrics, logs and traces) from systems and applications so you can monitor and troubleshoot effectively. Many Google Cloud services, including Google Compute Engine, provide basic system metrics out of the box.