Operations | Monitoring | ITSM | DevOps | Cloud

Latest Posts

Managing the Looker ecosystem at scale with SRE and DevOps practices

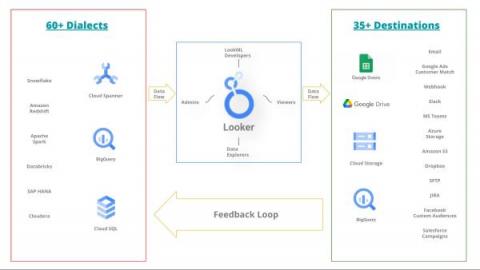
Many organizations struggle to create data-driven cultures where each employee is empowered to make decisions based on data. This is especially true for enterprises with a variety of systems and tools in use across different teams. If you are a leader, manager, or executive focused on how your team can leverage Google's SRE practices or wider DevOps practices, definitely you are in the right place!

More support for structured logs in new version of Go logging library

The new version of the Google logging client library for Go has been released. Version 1.5 adds new features and bug fixes including new structured logging capabilities that complete last year's effort to enrich structured logging support in Google logging client libraries. Here are few of the new features in v1.5: Let's look into each closer.

Cloud Monitoring metrics, now in Managed Service for Prometheus

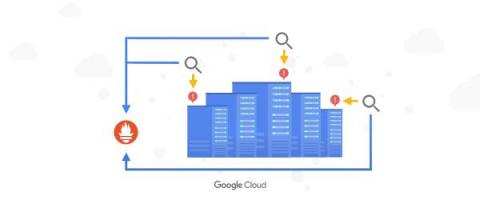
According to a recent CNCF survey, 86% of the cloud native community reports that they use Prometheus for observability. As Prometheus becomes more of a standard, an increasing number of developers are becoming fluent in PromQL, Prometheus’ built-in query language. While it is a powerful, flexible, and expressive query language, PromQL is typically only able to query Prometheus time series data.

Get more insights with the new version of the Node.js library

We’re thrilled to announce the release of a new update to the Cloud Logging Library for Node.js with the key new features of improved error handling and writing structured logging to standard output which becomes handy if you run applications in serverless environments like Google Functions!

Alerting on error log messages in Cloud SQL for SQL Server

With Cloud SQL for SQL Server, you can bring your existing SQL Server on-premises workloads to Google Cloud. Cloud SQL takes care of infrastructure, maintenance, and patching so you can focus on your application and users. A great way to take better care of your application is by monitoring the SQL Server error log for issues that may be affecting your users such as deadlocks, job failures, and changes in database health.

Introducing a high-usage tier for Managed Service for Prometheus

Prometheus is considered the de facto standard for Kubernetes application metrics, but running it yourself can strain engineering time and infrastructure resources when your usage grows. In March, we announced the general availability of Google Cloud Managed Service for Prometheus to help you offload that burden, and today, we’re excited to announce a new low-cost, high-usage pricing tier designed for customers who are moving large volumes of Kubernetes metrics over to the service.

New observability features for your Splunk Dataflow streaming pipelines

We’re thrilled to announce several new observability features for the Pub/Sub to Splunk Dataflow template to help operators keep a tab on their streaming pipeline performance. Splunk Enterprise and Splunk Cloud customers use the Splunk Dataflow template to reliably export Google Cloud logs for in-depth analytics for security, IT or business use cases.

Are your SLOs realistic? How to analyze your risks like an SRE

Setting up Service Level Objectives (SLOs) is one of the foundational tasks of Site Reliability Engineering (SRE) practices, giving the SRE team a target against which to evaluate whether or not a service is running reliably enough. The inverse of your SLO is your error budget — how much unreliability you are willing to tolerate.

Announcing new simple query options in Cloud Logging

When you’re troubleshooting an issue, finding the root cause often involves finding specific logs generated by infrastructure and application code. The faster you can find logs, the faster you can confirm or refute your hypothesis about the root cause and resolve the issue! Today, we’re pleased to announce a dramatically simpler way to find logs in Logs Explorer.

Deliver exception messages through Slack and Webhooks for fast resolution

Building new applications is a lot of fun, but troubleshooting and fixing the crashes that can come with app development is not. While many organizations are fast adopting the DevOps model, there are still some legacy frameworks where developers and operations teams are separate. Developers build and submit apps to their ops team, who in turn deploy and maintain the production stack. A common issue that arises due to this workflow is the time it takes to find and resolve crashes.