Operations | Monitoring | ITSM | DevOps | Cloud

Latest Posts

Simplify microservice governance with the Datadog Service Catalog

Moving from a monolith to microservices lets you simplify code deployments, improve the reliability of your applications, and give teams autonomy to work independently in their preferred languages and tooling. But adopting a microservices architecture can bring increased complexity that leads to gaps in your team members’ knowledge about how your services work, what dependencies they have, and which teams own them.

Monitor your GitHub Actions workflows with Datadog CI Visibility

GitHub Actions provides tooling to automate and manage custom CI/CD workflows straight from your repositories, so you can build, test, and deliver application code at high velocity. Using Actions, any webhook can serve as an event trigger, allowing you, for example, to automatically build and test code for each pull request. Datadog CI Visibility now provides end-to-end visibility into your GitHub Actions pipelines, helping you maintain their health and performance.

Monitor Citrix Hypervisor performance with Datadog

Citrix Hypervisor, formerly known as Citrix XenServer, is a type 1 hypervisor that enables organizations to run and manage an entire virtual infrastructure—including VMs, virtual desktops, and virtual applications. Organizations can also use Citrix Hypervisor to optionally host these virtual workloads with higher availability and flexibility by implementing managed server groups called resource pools.

Store and manage Datadog configurations as code with Performetriks' offering in the Datadog Marketplace

Performetriks is a service provider that specializes in assessing and improving application performance and security for enterprise clients. To streamline these processes, Performetriks offers frameworks for automation, benchmarking, and security testing, as well as tools that evaluate and improve application performance. This includes their Composer tool, an on-prem piece of software that allows teams to more efficiently manage monitoring settings by storing, tracking, and managing them as code.

Key metrics for monitoring Cilium

Cilium is a Container Network Interface (CNI) for securing and load-balancing network traffic in your Kubernetes environment. As a CNI provider, Cilium extends the orchestrator’s existing network capabilities by giving teams more control over how they build their applications and monitor traffic. For example, vanilla Kubernetes installations typically rely on traditional firewalls and Linux-based network utilities like iptables to filter pod-to-pod traffic by an IP address or port.

Monitor Cilium and Kubernetes performance with Hubble

In Part 1, we looked at some key metrics for monitoring the health and performance of your Cilium-managed Kubernetes clusters and network. In this post, we’ll look at how Hubble enables you to visualize network traffic via a CLI and user interface. But first, we’ll briefly look at Hubble’s underlying infrastructure and how it provides visibility into your environment.

Monitor Cilium-managed infrastructure with Datadog

In Part 2 of this series, we showed how Hubble, Cilium’s observability platform, enables you to view network-level details about service dependencies and traffic flows. Cilium also integrates with various standalone monitoring tools, so you can track the other key metrics discussed in Part 1. But since the platform is an integral part of your infrastructure, you need the ability to easily correlate Cilium network and resource metrics with data from your Kubernetes resources.

Monitor CockroachDB performance metrics with Datadog

CockroachDB is a highly resilient distributed SQL database developed by Cockroach Labs. CockroachDB assures ACID semantics and aims to make it easy to scale horizontally by adding nodes instead of manually sharding the database. Built to be resilient (much like its namesake insect) and highly available as it scales, CockroachDB readily recovers from node failures by repairing and rebalancing automatically.

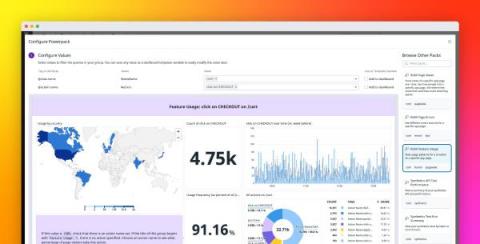
Save and share reusable dashboard widget groups with Powerpacks

Dashboards allow you to visualize and correlate monitoring data from across disparate data sources, technologies, and infrastructure components to understand what’s going on in your environment. In a growing organization, it’s paramount to standardize how teams build their dashboards to ensure their consistency and legibility.

Analyze VPC Flow Logs for AWS Transit Gateway in Datadog

AWS Transit Gateway is a service that makes it easy to connect multiple Amazon Virtual Private Clouds (VPCs), AWS accounts, AWS Regions, and on-premises networks together through a central hub. For AWS customers operating at global scale with many accounts and VPCs, AWS Transit Gateway greatly simplifies AWS networking architecture by eliminating the need to manage complex peering relationships and massive route tables.