Operations | Monitoring | ITSM | DevOps | Cloud

Latest Posts

Monitor Microsoft Hyper-V with Datadog

Hyper-V is a hardware virtualization platform used to create and run virtual machines on Windows host systems. Hyper-V allocates resources from the physical hosts it runs on to the virtual machines it creates. If those resources are spread too thin, virtual machines may encounter slow performance and startup failures. With our new integration you can monitor the health of every layer of your Hyper-V stack: physical hosts, virtual machines, and all of the applications and services running on them.

How to collect, customize, and analyze PHP logs

PHP logs are not just about errors. You can use logs to track the performance of API calls and function calls, or to count the occurrence of significant events in your applications (e.g., logins, signups, and downloads). Whether you’re operating a microservices architecture or a monolith, implementing a comprehensive PHP logging strategy will allow you to track critical changes in your applications and optimize their performance.

Forrester's new Wave report and the consolidation of monitoring

We’re thrilled to share that Datadog has been recognized by Forrester Research as a Leader in its report, The Forrester Wave™: Intelligent Application And Service Monitoring, Q2 2019. Unlike previous industry analyst reports, which focused specifically on application performance or IT operations, this report gives a nod to the changing landscape, where customers want to have a unified view across all components of their software for faster problem detection and diagnosis.

Monitor Twistlock with Datadog

Twistlock is a platform for managing security and compliance within various environments, including virtual machines, containers, and serverless functions. Ensuring legal and technical security is just as valuable as preventing outages and errors, which is why Datadog is delighted to announce a new integration with Twistlock. With this integration, you can track security and compliance risks within the same platform as the metrics, traces, and logs you already collect with Datadog.

Monitor MongoDB Atlas with Datadog

MongoDB Atlas is a fully managed NoSQL database that deploys onto the cloud platform of your choice: AWS, Azure, or GCP. Atlas provides built-in security features and automatically distributes clusters across availability zones to help ensure high availability and uptime. We’re excited to announce that with our new integration, you can now monitor MongoDB Atlas health and performance metrics alongside the rest of your cloud infrastructure and the applications that depend on your database.

Track the status of your SLOs with the new monitor uptime and SLO widget

Service level objectives are an important tool for maintaining application performance, ensuring a consistent customer experience, and setting expectations about service performance for both internal and external users. We are very pleased to announce the availability of a new monitor uptime and SLO widget that makes it simple to monitor the status of your SLOs and communicate that status to your teams, executives, or external customers.

User experience monitoring with Datadog browser tests

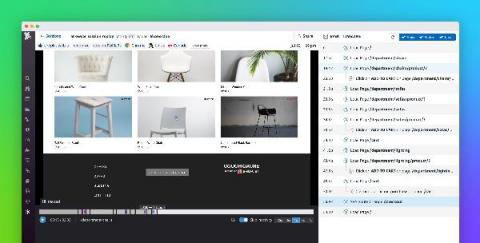
Datadog’s new automated browser tests enable you to automate your user experience monitoring and ensure that your users can complete actions like signing up for a new account or adding items to a cart. Anyone on your team can record and automate multistep browser tests in minutes. Once you create a test, Datadog uses machine learning to detect changes to your application and automatically update your tests accordingly.

Correlate request logs with traces automatically

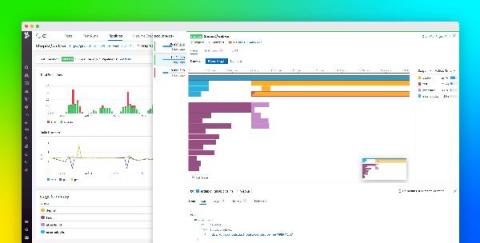
When your users are encountering errors or high latency in your application, drilling down to view the logs from a problematic request can reveal exactly what went wrong. By pulling together all the logs pertaining to a given request, you can see in rich detail how it was handled from beginning to end so you can quickly diagnose the issue.

Monitor AIX with the Datadog Unix Agent

Even in an era where container, serverless, and cloud-computing technologies garner considerable attention, many companies continue to run a sizeable share of their mission-critical applications on highly resilient, fault-tolerant systems such as IBM AIX on Power-series hardware. AIX, one of the most popular Unix-based operating systems, is trusted by large companies that process critical data such as medical health records and banking transactions.

How to collect, customize, and centralize Python logs

Python’s built-in logging module is designed to give you critical visibility into your applications with minimal setup. Whether you’re just getting started or already using Python’s logging module, this guide will show you how to configure this module to log all the data you need, route it to your desired destinations, and centralize your logs to get deeper insights into your Python applications.