Operations | Monitoring | ITSM | DevOps | Cloud

Latest Posts

New Resources for Contributors to the Grafana Project

Earlier this month, Ivana Huckova, one of Grafana’s junior developers, wrote an article about how to contribute to Grafana as a junior dev. As an open-source project supported by engineers around the world, Grafana strongly encourages anyone to contribute. And ICYMI, there are many opportunities to help: Testing the UI and reporting issues, finding and fixing bugs, and improving the documentation are just a few.

Grafana Labs at 5: How We Got Here and Where We're Going

In the beginning, there was a developer using Graphite, and he found its user interface lacking. Then he discovered the Kibana project, liked its UI, and forked it. Grafana was born in 2013. “I started Grafana to do something similar as Kibana, but focused on time series metrics. My goal was to make time series data accessible for a wider audience, to make it easier to build dashboards, to make graphs and dashboards more interactive,” says Torkel Ödegaard.

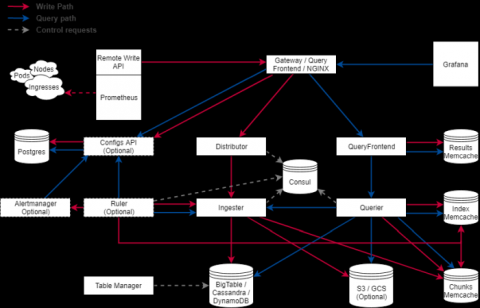
Deduping HA Prometheus Samples in Cortex

One of the best practices for running Prometheus in production environments is to use a highly available setup, in which multiple Prometheus instances all scrape the same targets. This means multiple instances have all your metrics data, so if one fails, the data is still available on another. Ideally, each instance would run on a separate machine.

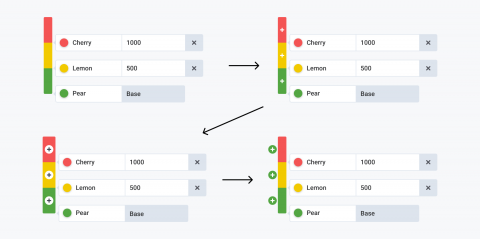
Behind the Grafana UX: Redesigning the Thresholds Editor

As part of building the new Gauge panel in React, we also wanted to update the panel controls, especially the thresholds control. A threshold in the context of Grafana is simply a value that, when exceeded, a condition occurs. An example would be a single stat panel with a green background that changes its background color to red when a threshold is breached.

How Many Metrics? A Guide to Estimating the Size of Your System

Our hosted metrics offering, Grafana Cloud, is billed based on usage; a common question we get is “How much will it cost to monitor N servers?” We charge $49/month for every 3,000 active series or 18,000 data points per minute (dpm), whichever is higher. To help you understand what that translates to in terms of how much storage you need, here’s a rough guide to estimating the size of your system.

How to Fix a Broken Grafana Dashboard with the API

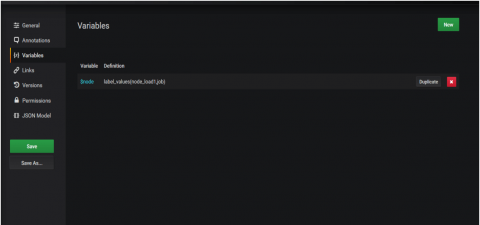
Recently, we ran into a problem where a customer’s dashboard broke to such an extent that it hung on loading. This is a really rare problem and in this case was an instance where the customer had created a variable that referenced itself. Once the dashboard is broken in this way, it is impossible to reach a screen allowing you to remove that variable. This post is not about how it was broken, but about how we resolved the error.

How We've Made It Easy to Migrate Data Using Metrictank Importer Tools

There’s a huge need among our Metrictank and Grafana Cloud customers to be able to import their existing data from Graphite, so we recently refactored the importer tools to make the process easier. A few years ago, I wrote a utility to import Whisper data into Cassandra. At that time, Cassandra was the only store that Metrictank supported. But since then, we’ve added Bigtable, and we’ll likely add more stores.

From Homegrown to Hosted: How The Trade Desk Migrated to a Modern Monitoring System with Grafana Cloud

When Patrick O’Brien interviewed to become a Site Reliability Engineer at The Trade Desk™, it was clear that taking the company’s monitoring system to the next level was the priority. “A chunk of my interview was about The Trade Desk’s previous monitoring system and how to scale it,” says O’Brien, who joined The Trade Desk more than two years ago. “I had a good feeling that would be an early task.”