Operations | Monitoring | ITSM | DevOps | Cloud

Latest Posts

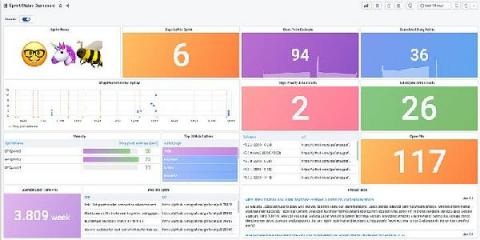
Homelab Security with OSSEC, Loki, Prometheus, and Grafana on a Raspberry Pi

For many years I have been using an application called OSSEC for monitoring my home network. The output of the application is primarily email alerts which are perfect for seeing events in near real-time. In this post, I’ll be showing you how to build a good high-level view of these alerts over time with Loki, Prometheus, and Grafana.

How Grafana Labs Effectively Pairs Loki and Kubernetes Events

As we’ve rolled out Loki internally at Grafana Labs, we wanted logs beyond just simple applications. Specifically while debugging outages due to config, Kubernetes, or node restarts, we’ve found Kubernetes events to be super useful. The Kubernetes events feature allows you to see all of the changes in a cluster, and you can get a simple overview by just retrieving them: This also captures when nodes go unresponsive and when a pod has been killed along with the reason.

Loki's Path to GA: Query Optimization, Part Three

Launched at KubeCon North America last December, Loki is a Prometheus-inspired service that optimizes storage, search, and aggregation while making logs easy to explore natively in Grafana. Loki is designed to work easily both as microservices and as monoliths, and correlates logs and metrics to save users money. Less than a year later, Loki has almost 6,500 stars on GitHub and is now quickly approaching GA.

Loki's Path to GA: Query Optimization, Part Two

Launched at KubeCon North America last December, Loki is a Prometheus-inspired service that optimizes storage, search, and aggregation while making logs easy to explore natively in Grafana. Loki is designed to work easily both as microservices and as monoliths, and correlates logs and metrics to save users money.

Loki's Path to GA: Query Optimization, Part One

Launched at KubeCon North America last December, Loki is a Prometheus-inspired service that optimizes storage, search, and aggregation while making logs easy to explore natively in Grafana. Loki is designed to work easily both as microservices and as monoliths, and correlates logs and metrics to save users money. Less than a year later, Loki has almost 6,500 stars on GitHub and is now quickly approaching GA.

New in Grafana v6.3: Introducing Loki's Log Row Context Viewer

With the release of Grafana v6.3, we are introducing a significant improvement to Loki’s log exploration workflow in Grafana Explore. Launched at KubeCon North America last December, Loki is a Prometheus-inspired service that optimizes storage, search, and aggregation while making logs easy to explore natively in Grafana. Loki is designed to work easily both as microservices and as monoliths, and correlates logs and metrics to save users money.

Loki's Path to GA: Live Tailing

Launched at KubeCon North America last December, Loki is a Prometheus-inspired service that optimizes storage, search, and aggregation while making logs easy to explore natively in Grafana. Loki is designed to work easily both as microservices and as monoliths, and correlates logs and metrics to save users money. Less than a year later, Loki has almost 6,500 stars on GitHub and is now quickly approaching GA.

Loki's Path to GA: Version 0.2.0

Friday, August 2, marked the second beta release for Loki, a long overdue version 0.2.0. Why did it take so long? In large part this was my fault. Having done some work to create a release process for version 0.1.0, I found myself focusing on other things, so improving that process ended up on the backburner. This entire time, in the back of my mind, I was delaying a new release until I could improve that process.

Ask Us Anything: Your Questions about MySQL, Elasticsearch, Grafana, and More

The Grafana Labs community has more than 600 developers around the world who contribute to our open source projects. From time to time, they also ask really great questions about how to get started in Grafana, how to solve an issue, or how to implement best practices for various functions. Here are three questions that have gotten some of the most clicks on the Grafana community board – and the answers from Grafana Labs’ Director of Software Engineering, Daniel Lee.