Operations | Monitoring | ITSM | DevOps | Cloud

Latest Posts

How We've Made It Easy to Migrate Data Using Metrictank Importer Tools

There’s a huge need among our Metrictank and Grafana Cloud customers to be able to import their existing data from Graphite, so we recently refactored the importer tools to make the process easier. A few years ago, I wrote a utility to import Whisper data into Cassandra. At that time, Cassandra was the only store that Metrictank supported. But since then, we’ve added Bigtable, and we’ll likely add more stores.

From Homegrown to Hosted: How The Trade Desk Migrated to a Modern Monitoring System with Grafana Cloud

When Patrick O’Brien interviewed to become a Site Reliability Engineer at The Trade Desk™, it was clear that taking the company’s monitoring system to the next level was the priority. “A chunk of my interview was about The Trade Desk’s previous monitoring system and how to scale it,” says O’Brien, who joined The Trade Desk more than two years ago. “I had a good feeling that would be an early task.”

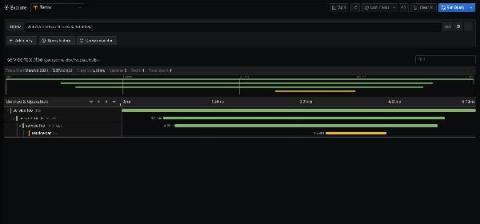
How Grafana Labs Is Running Jaeger at Scale with Prometheus and Envoy

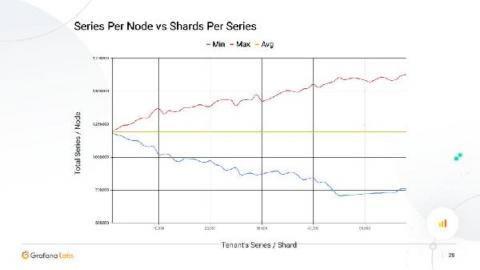
At Grafana Labs, we are always working on optimizing query time on our Grafana Cloud hosted metrics platform, which incorporates our Metrictank Graphite-compatible metrics service, and Cortex, the open source project for multitenant, horizontally scalable Prometheus-as-a-Service.

Streamlined Authentication, More Plugins, and Better Permission Structures with Grafana Enterprise

With the recent release of Grafana 6.3 substantial refactoring and improvements to plugins, external auth systems, and permissions have been introduced in Grafana Enterprise. Let’s take a look at some of the latest Enterprise features here.

How We Differentiate Grafana Enterprise from Open Source Grafana

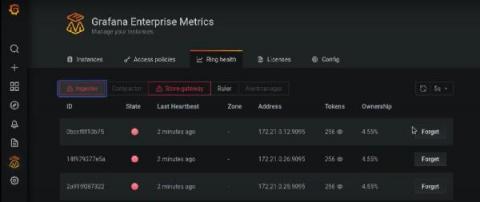
We are building Grafana Labs to be a sustainable open source company. In addition to maintaining the open source project and community around Grafana, we offer paid products that help make that possible. Grafana Enterprise was introduced over a year ago and adds features needed by enterprise-level organizations. In this blog post we’ll discuss some of those features and how we decide what goes into Grafana Enterprise.

The (Mostly) Complete History of Grafana UX

Before Grafana, there was Kibana 3. Kibana was revolutionary when it came out, because it allowed you to use Elasticsearch in a very new way, for log analytics and not just normal document search, and to build dashboards without writing JSON documents. It had this nice UI, which let you drag panels around. But editing panels was a little tricky; you could only edit them in this sort of fullscreen modal. Still, it was really good for its time.

New in Grafana 6.3: Easy-to-Use Data Links

At Grafana Labs, we constantly look for new opportunities to enhance workflows for our users. Our mission is for Grafana to be the missing piece in your system and a link between the three pillars of observability. No matter what your observability stack is composed of, we want Grafana to be the answer for bridging the gaps between metrics, logs, and traces.