Operations | Monitoring | ITSM | DevOps | Cloud

Latest Posts

Plexporters, Energize: How we monitor Plex with Grafana

As a Grafanista, you tend to find things to visualize — databases, microservices, classic video games, etc. It’s part of our “big tent” philosophy. So when our December hackathon rolled around, some of us in our internal homelab Slack channel decided to take a look at how we could get metrics out of our Plex Media Servers.

Grafana k6 v0.44.0 release: web crypto API, Web Vitals metrics, and more!

Grafana k6 v0.44.0 has been released, featuring new experimental modules, an upgraded browser module, and tons of improvements. Get Grafana k6 0.44.0 Here’s a quick overview of the latest k6 news from the team and the community.

Grafana 9.5 release: Grafana Alerting updates, stronger security with service accounts, upgraded dashboards, and more

Grafana 9.5 has arrived! 🔥🎉 Get Grafana 9.5 The latest Grafana release introduces new features and improvements, such as major Grafana Alerting improvements, dashboard and visualization enhancements, a redesigned navigation experience, support bundles for faster issue resolution, and much more to provide you with better insights into your data.

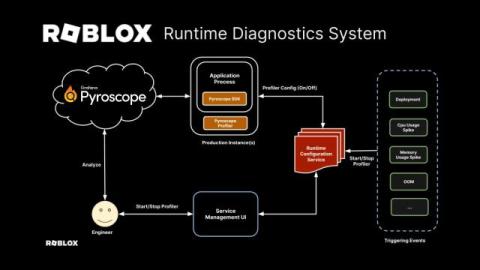
Multiple players, one stack: Inside Roblox's centralized observability stack

When you sign into the Roblox platform, you get 30 million immersive experiences, ranging from concerts to fashion shows to, of course, video games. But when the observability team at Roblox logs on, they’re not playing around. The Roblox observability engineers are responsible for keeping more than 214 million monthly users happy and engaged by making the wildly popular gaming platform highly available around the world.

Learn how to monitor IoT devices with Grafana

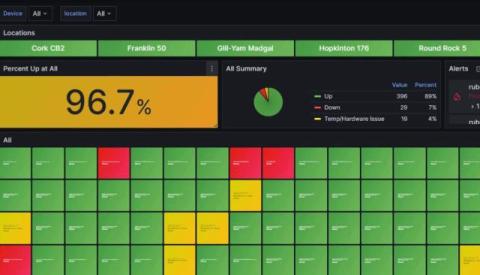
IoT devices open the door to all sorts of computing potential, but they can also produce a flood of telemetry data that users need to properly collect and monitor to ensure those devices are working properly. It’s no wonder so many individuals and businesses use Grafana for IoT use cases, whether they’re starting an aquaponic farm in South Africa, managing an industrial-scale electroplating factory in Ohio, or simply keeping tabs on Pretzel the python at its home in the UK.

Observability overload: Insights into the rise of tools, data sources, and environments in use today

With countless observability tools, data sources, and environments to juggle, the organizations that deploy and manage today’s distributed applications often face an uphill battle to gain visibility into their application performance. That was a key takeaway from the Grafana Labs Observability Survey 2023, which incorporated input from more than 250 industry practitioners who are all too familiar with these complexities.

How to troubleshoot memory leaks in Go with Grafana Pyroscope

Memory leaks can be a significant issue in any programming language, and Go is no exception. Despite being a garbage-collected language, Go is still susceptible to memory leaks, which can lead to performance degradation and cause your operating system to run out of memory. To defend itself, the Linux operating system implements an Out-of-Memory (OOM) killer that identifies and terminates processes that consume too much memory and cause the system to become unresponsive.

Grafana Cloud is now available in AWS Marketplace

Grafana Labs is excited to announce that Grafana Cloud is now available in AWS Marketplace. With this new offering, existing AWS customers can procure, deploy, and scale the fully managed Grafana LGTM observability stack (Loki for logs, Grafana for visualization, Tempo for traces, Mimir for Prometheus metrics) with just a few clicks.

Grafana Alerting: Searching for Grafana alerts just got faster, easier, and more accurate

Grafana Alerting enables users to create and customize alert rules as separate entities and link them to Grafana panels. It also supports various data sources with built-in alerting engines, such as Prometheus, Grafana Mimir, and Grafana Loki, allowing users to manage their alert rules directly from Grafana’s UI.