Operations | Monitoring | ITSM | DevOps | Cloud

Latest Posts

Why we're partnering with Elastic to build the Elasticsearch plugin for Grafana

As I’ve often talked about before, we have a “big tent” philosophy at Grafana Labs. We believe our users should determine their own observability strategy and choose their own tools; Grafana allows them to bring together and understand all their data, no matter where it lives. In practice, that means that we want to support data sources that our users are passionate about.

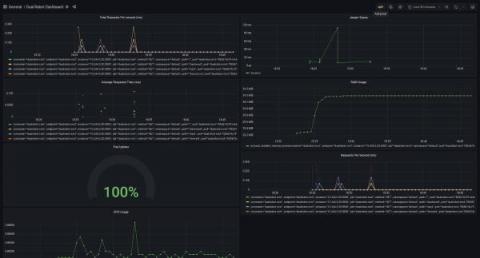
New in Grafana 7.4: Export usage data to Loki to help manage dashboard sprawl and troubleshoot faster

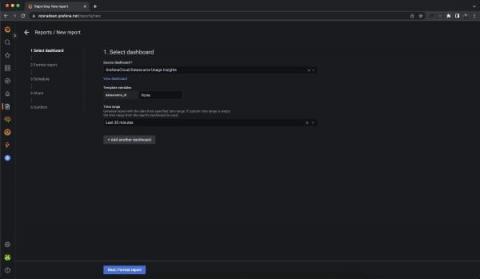
We first released the usage insights Enterprise feature in Grafana 7.0 based on feedback from customers that they would like to better understand how their users are interacting with Grafana, including the dashboards they visit, the information they query, and where they run into issues. What we learned was that dashboard sprawl is a real issue: Administrators estimate that almost 60% of dashboards might not be used at all.

Troubleshoot problems using GitLab activity data with the new plugin for Grafana

GitLab is one of the most popular web-based DevOps life-cycle tools in the world, used by millions as a Git-repository manager and for issue tracking, continuous integration, and deployment purposes. Today, we’re pleased to announce the first beta release of the GitLab data source plugin, which is intended to help users find interesting insights from their GitLab activity data.

You should know about... transformations in Grafana

Transformations were introduced in Grafana v7.0, and I’d like to remind you that you can use them to do some really nifty things with your data. All performed right in the browser! Transformations process the result set of a query before it’s passed on for visualization. They allow you to join separate time series together, do maths across queries, and more. My number one use case is usually doing maths across multiple data sources.

The new Splunk Infrastructure Monitoring plugin brings the SaaS formerly known as SignalFx to your Grafana dashboards

Greetings! This is Mike reporting from the Solutions Engineering team at Grafana Labs. In previous posts, you might have read our beginner’s guide to distributed tracing and how it can help to increase your application’s performance. In this post, we are back to talk about metrics and showcase another one of our newest favorite Enterprise plugins: Splunk Infrastructure Monitoring (formerly known as SignalFx)!

The 3 major benefits that Grafana Cloud customers get from our hosted Prometheus service

Grafana Cloud is the easiest way to get what you need for observability: Prometheus and Graphite for metrics, Loki for logs, and Tempo for tracing, all integrated within Grafana and managed by the Grafana Labs team. You can go from zero to beautiful graphs, insightful logs, and preconfigured alerts in minutes. Built with modern distributed systems techniques, Grafana Cloud allows you to grow with your applications and infrastructure and easily scale past 100M+ metrics.

Introducing Grafana Enterprise Logs, a core part of the Grafana Enterprise Stack integrated observability solution

Today, we are launching a new Grafana Labs product, Grafana Enterprise Logs. Powered by the Grafana Loki open source project for cloud native log aggregation, and built by the maintainers of the project, this offering is an exciting addition to our growing self-managed observability stack tailored for enterprises.

The essential config settings you should use so you won't drop logs in Loki

In this post, we’re going to talk about tips for securing the reliability of Loki’s write path (where Loki ingests logs). More succinctly, how can Loki ensure we don’t lose logs? This is a common starting point for those who have tried out the single binary Loki deployment and decided to build a more production-ready deployment. Now, let’s look at the two tools Loki uses to prevent log loss.

Instrumenting a .NET web API using OpenTelemetry, Tempo, and Grafana Cloud

OpenTelemetry is a CNCF project that standardizes observability (logs, metrics, and traces) across many languages and tools. Today we will look at how we can use the OpenTelemetry .NET library to instrument a .NET 5.0 web API, to offload traces to Tempo and logs to Loki in Grafana Cloud. Grafana Cloud now has a free plan. Set up your account and follow along!