Operations | Monitoring | ITSM | DevOps | Cloud

Latest Posts

Grafana 7.5 released: Loki alerting and label browser for logs, next-generation pie chart, and more!

Grafana v7.5 has been released! This is the last stable release before we launch Grafana 8.0 at GrafanaCONline in June. Register for free now, so you won’t miss the great sessions we’re planning around all things Grafana. And if you’re doing something special with Grafana that you’d like to share with the community, the CFP for GrafanaCONline is open until 06:59 UTC on April 10! Now, back to 7.5.

2021: The year of Cortex for IoT?

My Grafana Labs colleague RichiH recently talked about why IoT and time series databases work so well together. It just so happens that we have a highly scalable time series database on hand. Let’s talk about that. My name is Goutham, and I am a maintainer for Cortex. I have been working on it for nearly three years out of the four-and-a-half years the project has existed. Cortex is built to serve as a scalable, long-term store for Prometheus.

How I fell in love with logs thanks to Grafana Loki

As part of my job as a Senior Solutions Engineer here at Grafana Labs, I tend to pretty easily find ways out of technical troubles. However, I was recently having some Wi-Fi issues at home and needed to do some troubleshooting. My experience changed my whole opinion on logs, and I wanted to share my story in hopes that I could open up some other people’s eyes as well. (I originally posted a version of this story on my personal blog in January.) First, some background info.

What's new in Grafana Cloud for March 2021: improvements to alerting, synthetic monitoring, and more

As the product manager for Grafana Cloud, I am constantly following the progress of all the new features that our engineering teams are working on, from early ideation to release. We’re always excited to share updates with the community, so you can all try them out and let us know what you think. So each month, I’ll be rounding up the latest Grafana Cloud features and improvements on the blog.

Why implementing Grafana Enterprise was a bright idea for U.K. energy supplier Utilita

Energy efficiency is a term often used to describe appliances or light bulbs. But when it comes to business, making sure your sales team — and customers — are being efficient with their personal energy is a big key to success. That was a major lesson learned by Utilita, the U.K.’s first and only specialist Smart Pay As You Go Energy supplier.

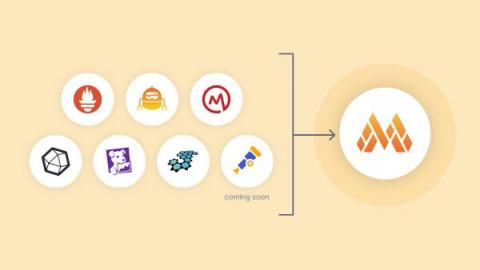
What's new in Grafana Enterprise Metrics for scaling Prometheus: enhanced access control and a compactor that supports 650 million active series and beyond

I’m a fresh starter here at Grafana Labs, leading one of our teams working on the Grafana Enterprise Stack. As a longtime user of Grafana, I couldn’t wait to see what’s new in versions 1.1 and 1.2 of Grafana Enterprise Metrics (GEM), our scalable, self-hosted Prometheus service. I tried out the shiny features and wanted to share some of the cool things I found.

Grafana Loki 2.2 released: Multi-line logs, crash resiliency, and performance improvements

I imagine everyone is long since tired and bored with their Loki 2.1 end of year/holiday gift, so I’m here today to bring some really exciting news. Loki 2.2 is released!!! New to Loki? Want a refresher? Owen Diehl and I did a webinar not long ago. Check out the on-demand video for a good overview of what Loki is capable of in 2021! Lots of new features are in this release, but worth celebrating in particular is that the single most requested feature for Loki has been added!

The basics of IoT, and why Prometheus works so well with it

Before we start, please take a moment to appreciate what day it is. IoT, or Internet of Things, has been a buzzword for longer than usual. Buzzwords usually have two common properties, and then their paths fork. I like thinking about buzzwords and about the useful aspects of what they mean. The most recent public example focuses on another buzzword currently in its hype phase: observability.

A closer look at the admin API and plugin for centralized tenant adminstration and control in Grafana Enterprise Logs

To follow up on our introduction of Grafana Enterprise Logs, the latest addition to the Grafana Enterprise Stack, let’s dig into one of the key features: the admin API and admin plugin. Grafana Loki, Grafana Labs’ log aggregation project, provides the underpinnings of Grafana Enterprise Logs (GEL).

How I built a monitoring system for my avocado plant with Arduino and Grafana Cloud

A couple months ago, during our Grafana hack days, I created my first monitoring solution: my sourdough monitoring system. It was a lot of fun to build it, and I enjoyed it a lot! So when the next Grafana hack day was approaching, I started to wonder what my next monitoring system could be. What would I like to learn more about? What would I like to get better at doing? To be honest, I didn’t have to think hard.