Operations | Monitoring | ITSM | DevOps | Cloud

Latest Posts

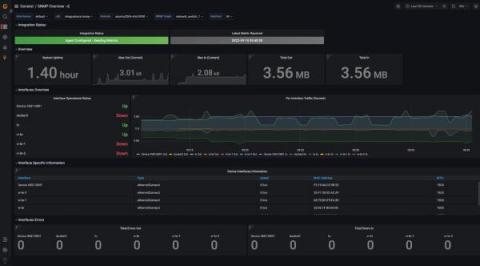
Using Grafana to measure the health of your NGINX instances with NGINX Instance Manager

Grafana is an extremely powerful application and infrastructure observability and health platform. The ability to quickly generate operational insights from an amalgamation of sources is compelling. Grafana also benefits from the ability to natively query a Prometheus endpoint to display time-based metrics for display in a dashboard. We’ve built the NGINX Instance Manager tool to measure the health of your NGINX instances with the help of Grafana.

GrafanaCONline 2021 Day 3 recap: Grafana Tempo deep dive, plus how Grafana helps grow e-commerce, scale NFT platforms, and more!

Welcome to week 2 of GrafanaCONline 2021! There are three more days of programming that you can tune into live by registering here. You will also be able to watch all the videos on demand after GrafanaCONline ends on June 17. Here’s what you missed on Day 3 of GrafanaCONline.

The new unified alerting system for Grafana: Everything you need to know

Alerting is the part of the Grafana open source project that has received the most requests for features and improvements. For some time now, the changes have been minimal, but we’ve been listening to the community. With Grafana 8, our investment in alerting is here.

GrafanaCONline Day 2 recap: Grafana 8 deep dive, Prometheus innovation, a billion time series at Robinhood, and more

GrafanaCONline 2021 is off to a great start! Tune in live (for free!) or sign up to get notified about on-demand access to all the session recordings, which will be available after GrafanaCONline ends. If you didn’t get a chance to watch yesterday’s presentations, here’s what you missed on Day 2 of the conference.

Grafana Tempo is now GA with the release of v1.0

It’s exciting to see a project that you’ve poured so much time into progress at the rate Tempo has. Tempo is not the first piece of software I have shepherded from the very first line of code to a production release, but it is the first large-scale open source project I have led. Working with a community that is able to use and improve your software as a community is a powerful thing.

GrafanaCONline Day 1 recap: Grafana 8, Tempo GA, machine learning, ISS, and more!

GrafanaCONline 2021 is live! Join us over the next two weeks for more than 30 virtual sessions, ranging from demos of the new Grafana 8.0 release and technical deep dives around Grafana, Prometheus, Loki, and Tempo to insider looks at how companies are leveraging Grafana in observability, IoT, science, and business intelligence. GrafanaCONline 2021 runs through June 17.

GrafanaCONline 2021: Your guide to the newest announcements from Grafana Labs

In addition to all the great talks from community members about their use cases, GrafanaCONline 2021 will include a number of sessions with the Grafana team about the latest features and use cases for Grafana. Throughout the week, we’ll continue to unveil new features, go deeper with live demos, and share our plans about the future of Grafana.

Visualize Humio logs alongside your other data sources in Grafana Cloud with the new plugin for Grafana

Being able to get the big picture and immediately pivot between siloed data is one of the key values Grafana Cloud provides. Our composable observability platform integrates Prometheus and Graphite metrics, Loki logs, and Tempo traces with Grafana — and also allows you to draw data in from other sources of your choice concurrently.