Operations | Monitoring | ITSM | DevOps | Cloud

Latest Posts

AWS Distro for OpenTelemetry, Grafana, Prometheus, Loki, OpenMetrics, and beyond: How Open Standards continue to shape modern observability

AWS is announcing the AWS Distro for OpenTelemetry today. This is a distribution of OpenTelemetry, itself a CNCF sandbox project. This is part of a wider push towards Open Source, cloud native technologies, and modern observability, all based on Open Standards. This push can be observed across the whole technology sector, but with increasing velocity from within AWS. As they are the largest public cloud provider by far, this is noteworthy in and of itself.

Quick tip: How Prometheus can make visualizing noisy data easier

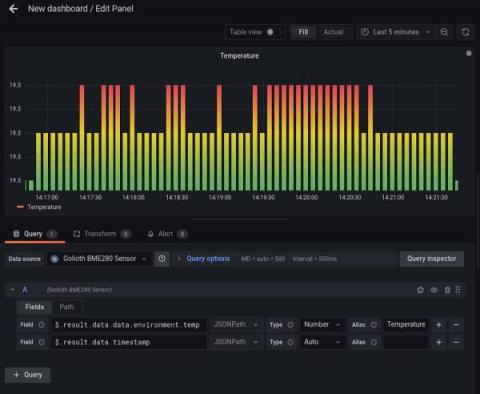
Most of us have learned the hard way that it’s usually cheaper to fix something before it breaks and needs an expensive emergency repair. Because of that, I like to keep track of what’s happening in my house so I know as early as possible if something is wrong. As part of that effort, I have a temperature sensor in my attic attached to a Raspberry Pi, which Prometheus scrapes every 15 seconds so I can view the data in Grafana.

How to switch Cortex from chunks to blocks storage (and why you won't look back)

If you’ve been following the blog updates on the development of Cortex – the long-term distributed storage for Prometheus – you surely noticed the recent release of Cortex 1.4, which focuses on making support for “blocks engine” production-ready. Marco Pracucci has already written about the blocks support in Cortex, how it reduces operational complexity for running Prometheus at massive scale, and why Grafana Labs has invested in all of that work.

We're making Prometheus use less memory and restart faster

A few months ago, I blogged about memory-mapping of full chunks of the head block from disk. The feature, which was introduced in Prometheus v2.19.0, brings down memory usage and restart time. Additionally, there’s another Prometheus feature in progress that snapshots in-memory data during shutdown for faster restarts; it’s expected to cut down the restart times by a big factor.

Learn Grafana: Share query results between panels to reduce load time

As you add more panels to your dashboard, more requests are being made, potentially leading to your dashboard taking longer to load. While you can limit the data requested in each query, one of the best ways to reduce the loading time is to reduce the number of requests being made to the data source. Grafana makes a data source query for each panel in your dashboard, even if those queries are identical.

New in Grafana Tanka: Customize Helm charts without modifying them

Helm charts are great. They combine high quality, ready-made runtime configurations for a huge number of applications with an incredible getting-started experience. There is literally no faster way to install a production-ready Grafana or Loki on Kubernetes than using helm install. Unfortunately, Helm charts can also be incredibly inflexible.

Now GA: Cortex blocks storage for running Prometheus at scale with reduced operational complexity

We’ve just launched Cortex 1.4.0, one of the most significant releases of 2020. The big headline: The new blocks storage engine has exited the experimental phase and is now marked as Generally Available. Blocks storage aims to reduce the operational complexity and costs of running a Cortex cluster at scale. In particular, it removes the dependency from a NoSQL database to store series indexes.

Intro to synthetic monitoring - and Grafana Labs' new iteration on worldPing

Often there’s a focus on how a service is running from the perspective of the organization. But what does service health monitoring look like from the perspective of a user? Today, understanding your end users’ experience is a key component of ensuring your website or application is functioning correctly. Having a website that is performing well regardless of location, load, or connection type is no longer a nice-to-have, but rather a requirement.

Introducing the AWS X-Ray integration with Grafana

In collaboration with the AWS team, we have just launched another AWS integration, the X-ray data source. Combined with the CloudWatch and Timestream integrations, the AWS X-Ray data source simplifies monitoring and triaging with one Grafana console. The addition of the AWS X-ray data source reflects Grafana’s commitment to becoming a full observability platform that supports distributed tracing as well as metrics and logs.