Operations | Monitoring | ITSM | DevOps | Cloud

Latest Posts

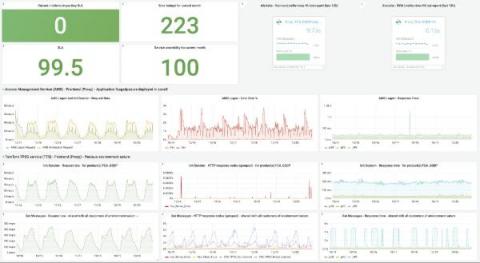
How we're using 'dogfooding' to serve up better alerting for Grafana Cloud

At Grafana Labs, we’re big fans of putting ourselves in the shoes of our customers. So when it comes to building a product, dogfooding is a term we throw around constantly. In short, what it means is that we actually use the products we create throughout their entire life cycle. And I really mean the whole life cycle.

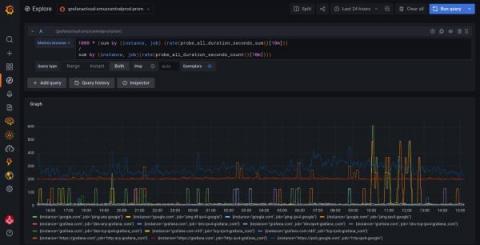
What recent optimizations in the Prometheus storage engine, TSDB, will enable in the future

At the recent PromCon Online, I gave a review of developments in the space of the Prometheus storage engine, TSDB. In this blog post I am going to recap a bit of the talk and add more insights into what these developments will enable us to do in the future. While the talk contained some of the near-future features, I will be diving even further ahead. You can watch the talk here.

Introducing the new and improved New Relic plugin for Grafana

It’s been a while, but the Kelly and Regis of Grafana Labs (a.k.a. Christine and Eldin of Solutions Engineering) are back to report on another Grafana Enterprise plugin: New Relic! The latest version of this plugin will be just one of the many topics we’ll cover during today’s webinar, All about Grafana plugins: Visualizing disparate data sources in one place. We’ll be hosting a great conversation around plugin updates, use cases, and the best way to make coffee.

Loki tutorial: How to send logs from EKS with Promtail to get full visibility in Grafana

Amazon Elastic Kubernetes Service (Amazon EKS) is the fully managed Kubernetes service on AWS. If you’re using it and wondering how to query all your logs in one place, Loki is the answer. With this tutorial, you’ll learn how to set up Promtail on EKS to get full visibility into your cluster logs while using Grafana. We’ll start by forwarding pods logs then nodes services and finally Kubernetes events.

How the Cortex and Thanos projects collaborate to make scaling Prometheus better for all

Cortex and Thanos are two brilliant solutions to scale out Prometheus, and many companies are now running them in production at scale. These two projects, both in the CNCF Sandbox, initially started with different technical approaches and philosophies: Cortex has been designed for scalability and high performances since day zero, while Thanos was originally focused on operational simplicity and cost-effectiveness.

Gardener, SAP's Kubernetes-as-a-service open source project, is moving its logging stack to Loki

Kristian Zhelyazkov is a developer at SAP working on Gardener, the SAP-driven Kubernetes-as-a-service open source project. In this guest blog post, he explains why the project is moving its logging stack to Loki.

Loki tutorial: How to set up Promtail on AWS EC2 to find and analyze your logs

Amazon’s Elastic Compute Cloud (AWS EC2) is one of the most popular ways to run applications in the cloud, but finding logs for a given instance is a common struggle. That’s where Loki can help. With Loki aggregation, you can group all your logs from all your virtual machines in one place, and with its search capabilities, you can quickly find and analyze them. It’s a great way to gain visibility in your cloud deployment.

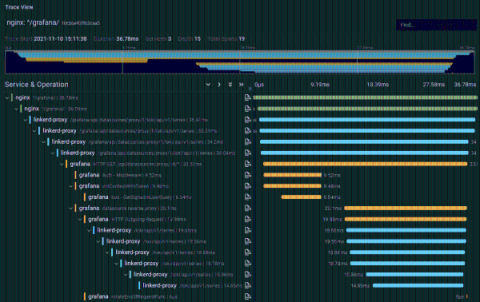
Where did all my spans go? A guide to diagnosing dropped spans in Jaeger distributed tracing

Nothing is more frustrating than feeling like you’ve finally found the perfect trace only to see that you’re missing critical spans. In fact, a common question for new users and operators of Jaeger, the popular distributed tracing system, is: “Where did all my spans go?” In this post we’ll discuss how to diagnose and correct lost spans in each element of the Jaeger span ingestion pipeline.