Operations | Monitoring | ITSM | DevOps | Cloud

Latest News

What is Digital Experience Monitoring?

Digital experience monitoring (DEM) is the evolution of application performance monitoring (APM) and end user experience monitoring (EUEM) into a comprehensive tool that analyzes the efficacy of an enterprise’s applications and services. Essentially, DEM combines these functions and goes beyond both — all to ensure consistency across the customer experience.

What is Data Center Colocation (Colo)?

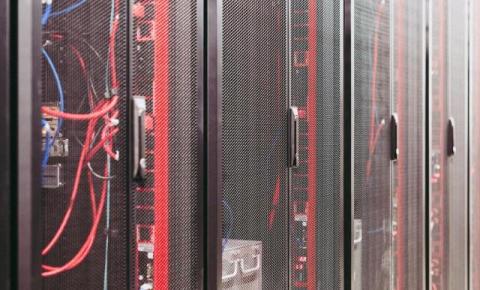
As IT costs continue to balloon, many organizations are caught between the desire to scale and the pressure to cut costs. It’s an incredibly delicate balancing act leaders struggle to maintain: while 66% of companies in one study said they plan to increase their IT budgets, 84% were worried about a recession, while 63% struggled to secure IT talent. By spending on infrastructure, organizations are forced to spend less on innovation. But what if there is a way to have both?

The Leading Java Performance Monitoring Tools

Java is a flexible and commonly used programming language known for its platform independence, object-oriented design, and robustness. It was originally developed by Sun Microsystems (now owned by Oracle Corporation) in the mid-1990s and soon gained popularity due to its "Write Once, Run Anywhere" (WORA) principle, allowing developers to write code that can operate on any device or platform with a Java Virtual Machine (JVM).

Optimize your RAG workflows with Elasticsearch and Vectorize

We’re excited to announce Vectorize now integrates with Elasticsearch vector database! This powerful combination simplifies building retrieval augmented generation (RAG) pipelines, allowing AI engineers to focus on building applications with unprecedented speed and accuracy. Elasticsearch vector database enables fast and efficient real-time search and retrieval of vector data, making it an excellent database for RAG applications.

Budget-Friendly Logging

OpenTelemetry has quickly become a must-have tool in the DevOps toolkit. It helps us understand how our applications are performing and how our systems are behaving. As more and more organizations move to cloud-native architectures and microservices, it's super important to have great monitoring and tracing in place. OpenTelemetry provides a strong and flexible framework for capturing data that helps DevOps engineers keep our systems running smoothly and efficiently.

Scaling Product Management for Hyper-Growth: Lessons from Cribl

Cribl has been experiencing rapid growth over the past six years as customers increasingly seek tools to modernize their data strategies. We introduced a new product, Cribl Lake, to help customers address even more diverse data management challenges. With customer data growing at a 28% CAGR, organizations are looking for solutions that can help them manage and optimize their data infrastructure.

Best Practices for Client-Side Logging and Error Handling in React

Logging is an essential part of development. While working on React projects, logging provides a way to get feedback and information about what’s happening within the running code. However, once an app or website is deployed into production, the default console provides no way to continue benefiting from logs.

RabbitMQ vs Kafka vs Redis

RabbitMQ, Apache Kafka, and Redis are some of the most popular microservices message brokers on the market. However, while they’re all the same type of tool, they each offer different features that make them better adapted for specific use cases. To further understand this, in this article, we will outline the main similarities and differences between these tools and highlight which is the best tool for various use cases.

Azure Logging Unleashed: Your Key to Cloud Performance

The Azure Cloud platform processes an extensive variety of data including Eventhub Diagnostic Logs, Kubernetes Metrics, SQL Logs, Activity Logs, Container Activity Logs, and Azure Metrics. Depending on the requirements of your organization these logs offer various levels of importance and priority. But it’s more than likely that you will be monitoring a large variety of these logs.