Operations | Monitoring | ITSM | DevOps | Cloud

Latest News

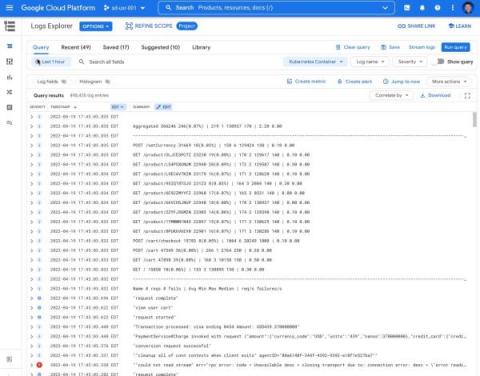
Announcing new simple query options in Cloud Logging

When you’re troubleshooting an issue, finding the root cause often involves finding specific logs generated by infrastructure and application code. The faster you can find logs, the faster you can confirm or refute your hypothesis about the root cause and resolve the issue! Today, we’re pleased to announce a dramatically simpler way to find logs in Logs Explorer.

Distributed Tracing Best Practices for Microservices

The management of modern software environments hinges on the three so-called “pillars of observability”: logs, metrics and traces. Each of these data sources provides crucial visibility into applications and the infrastructure hosting them. For many IT operations and site reliability engineering (SRE) teams, two of these pillars — logs and metrics — are familiar enough.

Splunk Operator 1.1.0 Released: Monitoring Console Strikes Back!

The latest version of the Splunk Operator builds upon the release we made last year with a whole host of new features and fixes. We like Kubernetes for Splunk since it allows us to automate away a lot of the Splunk Administrative toil needed to set up and run distributed environments. It also brings a resiliency and ease of scale to our heavy-lifting components like Search Heads and Indexer Clusters.

How to Keep DevOps in Sync with Business Needs

If you’re an engineer, it’s probably easy enough to appreciate the technical value of DevOps. DevOps makes software delivery faster, increases agility, improves collaboration and more. That being said, this is likely not the case for business professionals. They don’t always see the value of DevOps as clearly from their perspective. After all, even if you adopt the best DevOps tools and design optimal DevOps processes, there’s no guarantee that DevOps will drive business value.

Tools for Threat Hunting and IT Service Risk Monitoring

Cybersecurity can often seem intimidating for IT teams. After all, things like “threat hunting,” “red teaming,” and “blue teaming” are not used in IT operations. On the other hand, just because these words are terms of art doesn’t mean that they’re activities you don’t do already. You’re probably already using log data as part of your IT operations incident response.

Troubleshooting Sources and Destinations in Cribl Stream

This is Part One of a series of blogs around troubleshooting Cribl Stream. Part One will focus on identifying and troubleshooting issues with Sources and Destinations in Stream. I will cover some of the common problems that users face and how you can work through them and find the root cause.

Leveraging Elastic to improving data management and observability in the cloud

Two recent studies conducted by Nucleus Research, focused on how a global telecommunications provider, and multi-line insurance company realized quantified business value through Elastic. The companies that were studied saw great levels of satisfaction from deploying Elastic Cloud. Through their adoption they were able to increase the maturity of their tech stack and circumvent prior limitations in scalability.

Why is Application Performance Monitoring Important?

Picture this: Your on-call engineer gets an alert at 2 AM about a system outage, which requires the entire team to work hours into the night. Even worse, your engineering team has no context of where the issue lies because your systems are too distributed. Solving the problem requires them to have data from resources that live in another timezone and aren’t responsive. All the while, your customers cannot access or interact with your application, which, as you can imagine, is damaging.