Operations | Monitoring | ITSM | DevOps | Cloud

Latest News

Mastering Fortinet FortiGate Firewall Logs - Part 2 Optimization

FortiGate firewall logs are crucial for network security and compliance. These logs contain valuable information about network traffic, including source and destination IP addresses, ports, protocols, timestamps, and firewall actions. With FortiGate log volumes growing annually, many organizations face challenges in processing and storing these logs efficiently. In part 1 of this series, we covered an overview of Fortigate logs, and some of the challenges they pose for Security and DevOps teams.

How to Monitor SNMP with OpenTelemetry

With observIQ’s contributions to OpenTelemetry, you can now use free, open-source tools to easily aggregate data across your entire infrastructure to any or multiple analysis tools. The easiest way to use the latest OpenTelemetry tools is with observIQ’s distribution of the OpenTelemetry collector. You can find it here. In this blog, we cover how to use OpenTelemetry to monitor SNMP.

End-to-end SAP Observability with Elastic, Google Cloud, and Kyndryl: A deep dive

Tens of thousands of companies in the world, across almost all industries, from midsize to large enterprises, rely on robust, efficient complex SAP systems to power their core operations. From sales to finance, from warehouse management to production planning and execution, business’s continuity, revenue, and customer success highly depend on processes running on enterprise resource planning (ERP) architectures.

Mastering Log Monitoring: Boost Your IT Operations

With the development and increased usage of cloud-native technologies, containers, and microservices-based architectures, log monitoring has become a fundamental component of effective management for organizations. Logs offer users insights into occurring issues and assist them in understanding how their software performs over time, where it excels, and where it fails.

Syslog: Even Better Best Practices

The Cribl Syslog source is our most commonly used input type. Cribl Stream can act as your edge and/or central syslog server, giving you more capability while easing management tasks. In this blog post we’ll go over a brief history of syslog. Then we’ll dive into best practices for standing up Cribl Stream as a syslog server, tuning the server, and other tips for running a high performance syslog platform.

Building a Data Engine to Power the Future

In today’s digital era, data has become an integral part of every organization. The exponential growth of data continues to accelerate, with projections indicating a compound annual growth rate of 28% for data creation. While this surge in data presents vast opportunities, it also brings substantial challenges in terms of management and value extraction. This is where the concept of a data engine comes in. It serves as the core of your data infrastructure, functioning like a central nervous system.

How to customize your Loki deployment with Ansible

Michal Vaško is a DevOps engineer at cloudWerkstatt, with a passion for open source technology and a deep love for observability. While operations or platform teams have long relied on visibility into metrics to react swiftly, the idea of doing the same thing with logs was once just a dream. Thankfully, Grafana Loki has revolutionized the logging stack, giving you the same level of visibility with logs that you get with metrics.

The Top 8 Kafka Monitoring Tools

Apache Kafka has risen as a pivotal element in modern distributed systems, transforming data processing, storage, and distribution across diverse applications. Kafka, developed by Kafka, is an open-source distributed event streaming platform. It is designed to efficiently manage high volumes of real-time data, acting as a distributed messaging system.

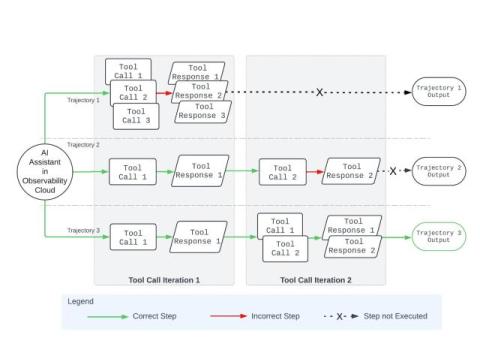
Building an AI Assistant in Splunk Observability Cloud

Splunk Observability Cloud is a full-stack observability solution, combining purpose-built systems for application, infrastructure and end-user monitoring, pulled together by a common data model, in a unified interface. This provides essential end-to-end visibility across complex tech stacks and various data types, such as metrics, events, logs, and traces (MELT), as well as end-user sessions, database queries, stack traces and more.