Operations | Monitoring | ITSM | DevOps | Cloud

Latest News

How Appwrite integrated Raygun for bulletproof error reporting: lessons learned

This guest post comes from Appwrite, an open-source backend-as-a-service platform helping developers build secure apps faster. Appwrite chose Raygun’s API for direct, lightweight error reporting that avoids SDK bloat and dependency risks. In this post, they share their journey integrating Raygun, the challenges they tackled, and the impact on their production environment. We’re excited to share these insights from the Appwrite team!

Enhance Network Automation with ManageEngine OpManager's New Integration with Ansible

ManageEngine OpManager now integrates with Ansible to bring advanced automation capabilities directly to your network management toolkit. This integration allows IT teams to automate critical tasks, streamline configurations, and resolve performance issues with ease, all from a single, unified platform. By leveraging Ansible’s robust automation features within OpManager, you can reduce manual efforts, minimize downtime, and ensure your network runs at peak efficiency.

Getting Started with Icinga: Your All-in-One Guide to Mastering Monitoring

If you’re looking for a comprehensive guide to getting started with Icinga, you’re in the right place. Whether you’re new to Icinga or a seasoned user who thinks they’ve seen it all, some of these resources could surprise you with a few tricks. Let’s dive into the resources that’ll have you saying, “Why didn’t I think of this sooner?” Or send this to someone you would like to rope into the Icinga universe.

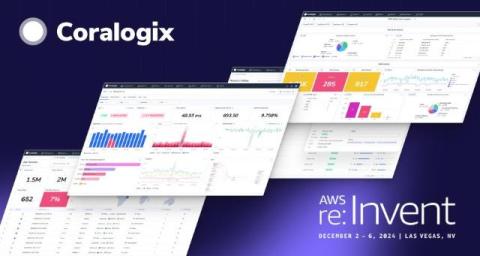
AWS re:Invent 2024: Discover the latest & greatest from Coralogix

As we gear up for AWS re:Invent this December, we’re excited to share some of the latest innovations that make our platform stand out. Coralogix continues to evolve with powerful new capabilities designed to simplify observability, improve performance monitoring, and deliver actionable insights across your systems. From advanced visualization tools to AI-powered troubleshooting, these updates reflect our commitment to empowering teams with smarter, faster ways to solve complex challenges.

How to install collectd and send metrics to MetricFire

MetricFire is a full-scale platform offering infrastructure, system, and application monitoring using open-source monitoring tools. The platform allows you to use Graphite-as-a-Service and display your metrics on aesthetically pleasing Grafana dashboards. Because of its powerful monitoring capabilities, MetricFire allows you to understand complex systems at a glance. This article will highlight everything you need to know to understand and use MetricFire for your business.

The Top 10 Prometheus Alternatives

Prometheus is an open-source monitoring solution, it offers efficient, scalable, and flexible monitoring practices and has emerged as a trusted tool for organizations seeking insights into their systems. It’s written in Go, gathers metrics data, and stores it in a time series database. Also, Prometheus employs a robust query language, PromQL, to manipulate and analyze collected time series data, offering versatile monitoring capabilities for various systems and services.