Operations | Monitoring | ITSM | DevOps | Cloud
OpsRamp In 2020 | A Year Like No Other
The new year is all about fresh starts, and certainly all of us need that. Still, it's useful to look back and review the events of the previous year. Here are some highlights of OpsRamp's company and product news in 2020.
Leaving 2020 Behind, What's the Role of Retail Stores in the Data Age?
From store shutdown to temporary closure and limited occupancy for non-essential retail businesses, 2020 was filled with many disappointments. America’s stores were in rough shape even before the pandemic, but COVID-19 has significantly compounded the challenging retail landscape, leaving behind businesses that could not adapt to the abrupt change in the operating environment.
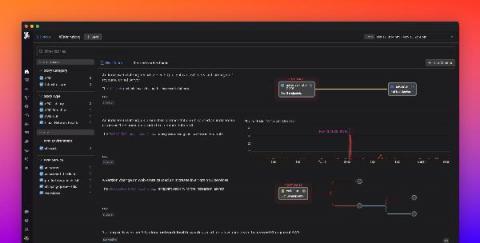
Service Map & Dashboards (beta) Provide Insight into Health and Dependencies of Microservice Architecture
How to Manage the Remote Onboarding Process and Retain Top Talent
If you’ve ever started a new job, you know what a whirlwind those first few days and weeks can feel like. A new job means meeting new faces, learning new processes, familiarizing yourself with new and unfamiliar technology, and discovering what new challenges you’ll be facing for the foreseeable future. It can all be quite overwhelming — particularly at companies that don’t offer top-of-the-line employee onboarding programs.
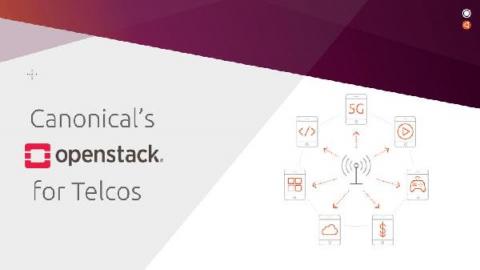
OpenStack for telcos by Canonical
OpenStack has been around for a good while now, and many of us associate it with the period of IT technology’s initial transition from individual appliance implementation on hardware, to cloud compute and virtualisation. And yet in 2020 we cannot skip this topic when talking telco infrastructure. So how is OpenStack still pertinent to telco organisations, and what in broad terms is new and exciting or worth discussing today about OpenStack?
Centralized Log Management and a Successful 2021
With 2020 dominated by a global pandemic, organizations expedited their digital transformation strategies. (According to TechFirst podcast, COVID19 accelerated digital transformation by an average of 6 years.) One of the most significant changes was the rapid move to a remote workforce. This required stopgap measures to keep the business running. While these measures met the company’s immediate needs, the measures also introduced anticipated and unanticipated issues.
Exoprise 2020 Year in Review
2020 is behind us. But we are still reeling under its effects. The disruption at work due to Covid left companies to rethink their IT strategy and focus on digital experience monitoring for their vast remote workforce. However, in these unprecedented times, Exoprise successfully managed to deliver the best monitoring outcomes to its global customers.
Automated root cause analysis with Watchdog RCA
Since 2018, Watchdog has provided automatic, machine learning-based anomaly detection to notify you of performance issues in your applications. Earlier this year, Watchdog started grouping APM anomalies across your services, allowing you to better understand the scope of the issue.
10 Tools That Make IT Specialist's Life Easier
As an IT specialist, you should have an aptitude for all the essential tools vital for the efficient running of IT infrastructure. These software programs designed for their specific purposes basically serve the same purpose as an engineer’s toolkit. They make it easy to get the job done, and on top of that, get it done well. Depending on your job, you may or may not need to use all the tools. But as an IT professional, you should know which tool can help you with which task.


