Learn how SquaredUp's Azure DevOps dashboards to see aggregate data across pipelines, releases and projects. You can also easily manipulate the data or combine it with data from other tools.
With SquaredUp's Azure dashboards, you can unlock the insights hiding in your Azure data by breaking down borders between accounts, regions, and tools.
Another release, another round of exciting features and updates! In this release webinar, Bruce Cullen, Director of Engineering at SquaredUp, will present Dashboard Server 6.2's latest enhancements.
In this video, learn how Grafana simplifies observability with our Application Observability solution, streamlining monitoring for distributed systems. See how we leverage OpenTelemetry and Prometheus to minimize mean time to resolution for complex application challenges. With a commitment to open-source protocols, you can empower your team to own their data and navigate system complexities with confidence. Delve into Grafana's architecture to unlock the full potential of observability in your systems.
New to Service Level Objectives (SLOs) and Service Level Indicators (SLIs)? Or curious how Grafana makes it easy to prioritize critical resources with SLO-driven Incident Response Management? In this recording, Marc and Mimi walk through a demo of Grafana SLO. See for yourself how Grafana SLO keeps your engineers in one location to ease collaboration and workflow automation during an incident response.
In this talk, RichiH (Office of the CTO) discusses the latest updates on our announcements from our flagship ObservabilityCON event in London 2023, including Explore Metrics, Explore Logs, Beyla, Asserts, Loki 3.0. Plus, learn how we're leveraging AI/ML to reduce a little bit of that toil in your observability practice. This talk includes a demo of Explore Logs and Asserts.
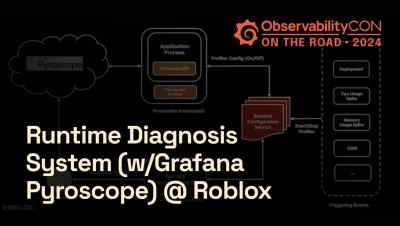
In this video, Xiaofeng and Jialin from Roblox introduce their journey in building a robust runtime diagnostic system using Pyroscope. With over 70 million daily active users and 4.4 million creators contributing to the platform, ensuring reliability and efficiency is paramount. They discuss the challenges faced in debugging production issues and the manual, inefficient methods previously used. Through thorough investigation and collaboration with Grafana Labs, they developed an on-demand profiling workflow, enabling engineers to identify and address performance bottlenecks effectively.
Watch the highlights from an engaging panel discussion with IoT experts from Toast, Samsara, Nordic Semiconductor, T-Mobile, Ovyl, and Memfault. The group discussed new research on the state of IoT software and shared practical advice on how to overcome common challenges.
It’s no secret that teamwork is one of those things that, when done right, can make a world of a difference. So sometimes, when responding to a particularly complicated incident, it can be best to bring a team together to figure out what’s going on and work towards a fix. But it’s not enough to just jam a bunch of folks into a room and hope for the best. You need a framework in place to ensure that everyone stays focused, diagnoses the issue and resolves it as quickly as possible.