Operations | Monitoring | ITSM | DevOps | Cloud

Logging

The latest News and Information on Log Management, Log Analytics and related technologies.

Illuminate 2020 Keynote: Christian Beedgen

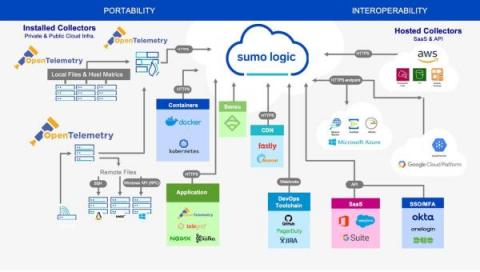
Watch as Christian Beedgen, Co-Founder & CTO of Sumo Logic shares his thoughts and musings on Sumo Logic’s ten year anniversary, and some great tech talk, including a demonstration of our end-to-end observability solution for DevSecOps. This keynote session was part of Sumo Logic’s 4th annual Illuminate user conference.

Top 10 Elasticsearch Metrics to Monitor

This article is part 2 of a four-part series of articles about Elasticsearch performance monitoring. Part 1 explains what Elasticsearch is and how it works, while in this part, we’re going to look at Elasticsearch’s capabilities and potential use cases, and how to check its status. We’ll identify key metrics that you need to monitor to maintain the health and performance of your Elasticsearch cluster.

How to Address the Most Common Microservice Observability Issues

Breaking down larger, monolithic software, services, and applications into microservices has become a standard practice for developers. While this solves many issues, it also creates new ones. Architectures composed of microservices create their own unique challenges. In this article, we are going to break down some of the most common. More specifically, we are going to assess how observability-based solutions can overcome many of these obstacles.

Running ELK on Kubernetes with ECK - Part 1

More and more employers are looking for people experienced in building and running Kubernetes-based systems, so it’s a great time to start learning how to take advantage of the new technology. Elasticsearch consists of multiple nodes working together, and Kubernetes can automate the process of creating these nodes and taking care of the infrastructure for us, so running ELK on Kubernetes can be a good options in many scenarios.

A Crash Course in Kubernetes Monitoring

Kubernetes monitoring can be complex. To do it successfully requires several components to be monitored simultaneously. First, it’s important to understand what those components are, which metrics should be monitored and what tools are available to do so. In this post, we’ll take a close look at everything you need to know to get started with monitoring your Kubernetes-based system.

New SAML Group Mapping Support

In July, we rolled out SolarWinds® Papertrail™ support for SAML v2.0. SAML authentication allows you to log into your Active Directory® domain or intranet and have immediate access to Papertrail, with no additional login required. Today we’re extending Papertrail SAML 2.0 support to include group mapping. Group mapping allows you to define organization and product roles, and grant access to logs and billings plans, by adding an account to an identify provider group.

Aggregating Hosted DigitalOcean Logs to Papertrail

DigitalOcean droplets provide low-cost scale from a popular server provider. With DigitalOcean Monitoring, you can collect metrics for visibility, monitor Droplet performance, and receive alerts when problems arise in your infrastructure. But when you need to deep dive into your application to debug an issue, resolve an incident, or identify opportunities to improve your platform, you need a deep understanding of the underlying operating system and how it interacts within its environment.

Application Performance Management for Microservices with Sumo Logic

Distributed tracing allows you to track the execution of your user's transactions by following them between applications’ microservices. It provides easy to understand visualizations of transactional lifespan with the ability to pinpoint any slowdowns and errors in response to microservices. During my presentation at Illuminate, I shared that we extended the Sumo Logic platform to cover application performance use cases.

20 Best Cloud Monitoring Tools of 2021: Pros & Cons Comparison

When providing services to your customers you need to keep an eye on everything that could impact your success with that – from low-level performance metrics to high-level business key performance indicators. From server-side logs to stack traces giving you full visibility into business and software processes that underpin your product. That’s where cloud monitoring tools and services come into play.