Operations | Monitoring | ITSM | DevOps | Cloud
The latest News and Information on Log Management, Log Analytics and related technologies.
Software Development Optimization in Jira Cloud
Software Development Optimization for Atlassian
Building Kibana dashboards more efficiently
Creating dashboards is quicker and easier than before with a new streamlined navigation experience, now available in Kibana 7.12. This dashboard-first approach makes it simple for you to create and add visualizations without leaving your dashboard-building flow. Get started directly from a Kibana dashboard with a few simple steps: Select Create Panel and choose what type of visual you want to build.
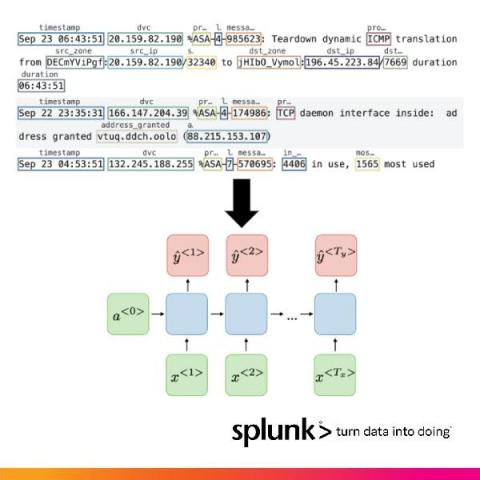
How Splunk Is Parsing Machine Logs With Machine Learning On NVIDIA's Triton and Morpheus
Large amounts of data no longer reside within siloed applications. A global workforce, combined with the growing need for data, is driving an increasingly distributed and complex attack surface that needs to be protected. Sophisticated cyberattacks can easily hide inside this data-centric world, making traditional perimeter-only security models obsolete.
Logit.io's Response To The Elasticsearch B.V. SSPL Licensing Change
On the 14th of January 2021, Elasticsearch B.V. announced that future releases of Elasticsearch and Kibana would be released under a dual license SSPL (Server Side Public License). As a result of this change it is evident that the components that make up Elasticsearch and Kibana in version 7.11 (and onwards) of the ELK Stack will no longer be considered as open source based upon the Open Source Initiative's requirements for licensing.
6 Data Cleansing Strategies For Your Organization
Profiles in Open Source: Dana Fridman & Contributing as a Product Designer
Dana Fridman is a design guru. Her contributions to UX at Logz.io are unmatched, and her input on upcoming updates to our app’s UI will be an achievement. But her portfolio is getting more than just Logz.io projects right now. As part of her work here, she is also making her mark on Jaeger. You see, Dana is the major design contributor to the open source Jaeger project. Open source contributions tend to be backend-focused and the domain of developers.
How to Collect and Visualize Windows Events From 5 Hosts in 5 Minutes
If you’re investigating incidents on your Windows hosts, sifting through the Event Viewer can be a painful experience. It’s best to collect and ship Windows Events to a separate backend for easier visualization and analysis – but depending on the solution you choose, this can take some significant legwork. Often, this can require manually configuring a 3rd party tool or agent, just to get started.
Web Assembly Deep Dive - How it Works, And Is It The Future?
You’ve most likely heard of Web Assembly. Maybe you’ve heard about how game-changing of a technology it is, and maybe you’ve heard about how it’s going to change the web. Is it true? The answer to this question is not as simple as a yes or no, but we can definitely tell a lot as it’s been around for a while now. Since November 2017, Web Assembly has been supported in all major browsers, and even mobile web browsers for iOS and Android.


