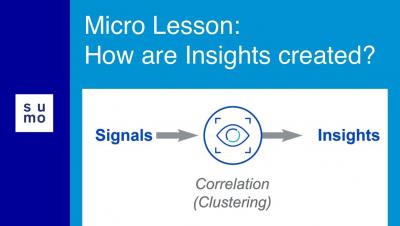
Microlesson: How are Insights Created?
Learn how Sumo Logic's Cloud SIEM Enterprise clusters log data into actionable security Insights.


The latest News and Information on Log Management, Log Analytics and related technologies.
Yes, there is the ability to silence or disable alerts in Graylog. There are times in IT environments where you know you are going to generate specific events in your network. As an example, you are patching servers, upgrading hardware components, and many other things. These types of activities are very common during maintenance windows.
Sumo Logic is a cloud-based log management and analytics service that leverages machine-generated big data to deliver real-time IT insights. We’re excited to share that you can now easily integrate Catchpoint and Sumo Logic, giving you a number of fantastic benefits. The integration involves pushing data from Catchpoint to Sumo Logic using Webhooks and then query the data to build visualizations. Why do we use Webhooks?
Today, we are pleased to announce a partnership with Confluent to jointly develop and deliver an enhanced product experience to the Kafka-Elasticsearch community. Kafka is — and has been since the very early days — an important component of the Elastic ecosystem.
Logz.io has pressed hard to align our tracing and metrics analytics capabilities over the past year. And as our technology advances, so does our service. We are announcing Multiple Tracing Accounts with Logz.io Distributed Tracing, aligning it with our logging and metrics tools. Complementing multiple data sources for metrics and logs, Logz users can segment their data according to sources and teams for better organization.
Link analysis, which is a data analysis approach used to discover relationships and connections between data elements and entities, has many use cases including cybersecurity, fraud analytics, crime investigations, and finance. In my last post, "Advanced Link Analysis: Part 1 - Solving the Challenge of Information Density," I covered how advanced link analysis can be used to solve the challenge of information density.
Nowadays, most applications we build are composed of microservices and distributed in nature. In such a setup, communication between these microservices is crucial, but can, unfortunately, cause some headaches. The first thing I check when I’m troubleshooting a bug in production is inter-service communication. Having a reliable tool at your disposal to take care of this can reduce a lot of stress. RabbitMQ, a hybrid messaging broker, is one such tool.