Logs are Not Human Scale: How to Build Observable Systems
Sam Stokes speaks at the O'Reilly Software Architecture conference in New York about how to build observable systems.


The latest News and Information on Log Management, Log Analytics and related technologies.
Earlier this year, we showed you how to monitor Amazon Web Services Elastic Load Balancer (AWS ELB) with Cloudwatch. This piece is a follow up to that, and will focus on Classic Load Balancers.
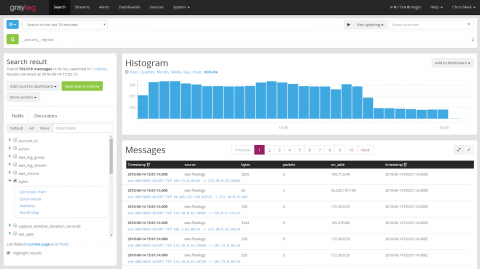
Welcome to part two of a three-part series on trend analysis of log event data. Today, we will explore how to perform, using Graylog, a few of the types of trend analysis discussed previously.
BOSTON and TEL AVIV, June 13, 2018 — Logz.io, the leading provider of AI-powered log analytics, releases a specialized Docker Logging Plugin, enabling users to easily ship container logs to Logz.io. The Docker Logging Plugin was created to relieve many of the common issues developers experience when shipping container logs such as complex configuration, accidental pausing of container shipments, and potential loss of data.
This article explores integrating Google Pub/Sub with the world’s most popular open source log analysis platform — the ELK Stack, for deeper analysis and investigation.
The Linux Audit framework is a kernel feature (paired with userspace tools) that can log system calls. For example, opening a file, killing a process or creating a network connection. These audit logs can be used to monitor systems for suspicious activity.
I continue to be intrigued by the evolution of software architectures and their impact on business. In my 20+ year career, I’ve participated in four of these architecture transitions – the shift from client-server to the internet, the rise of 3-tier architectures underpinning rich internet applications, virtualization that upended the dominance of hardware providers, and now the shift to microservices-based architectures based on cloud infrastructure and software automation.
If you’re building a new application from scratch and are responsible for maintaining its availability and performance, you might wonder whether you should be monitoring logs or metrics. For us, it’s a no-brainer that you’ll want both: metrics are fast and efficient for proactively monitoring the health of your system, while logs are essential for helping to troubleshoot the details of the issue itself to find the root cause.