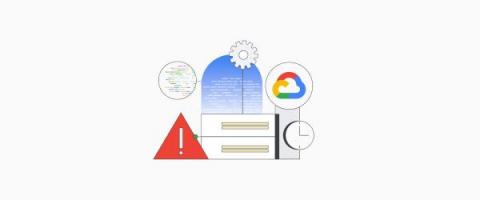
Trace exemplars now available in Managed Service for Prometheus
Connect your metrics to your traces with exemplars to quickly troubleshoot and resolve latency issues.


The latest News and Information on Monitoring for Websites, Applications, APIs, Infrastructure, and other technologies.
Connect your metrics to your traces with exemplars to quickly troubleshoot and resolve latency issues.
Device level monitoring is a relic of the past. Today's global IT landscape delivers services not devices and support organizations need to keep pace in an ever changing and evolving consumption driven world.
Time is precious and not for sale. Or is it? UMB AG, a leading Swiss IT service and managed services provider, takes the opposite view. Under the company motto "Creating Time", UMB provides its customers with more time which they use for their core business instead of IT administration. A core UMB service is complete support for SAP landscapes, be it on premise, in the UMB data centers or in the cloud. Here, UMB has relied on the artificial intelligence of the Avantra AIOps platform for a good five years in order to manage both its own SAP systems and its customers' as efficiently as possible.
Prometheus, developed by SoundCloud, is a powerful open-source system for service monitoring and time series data storage. It collects metrics from configured targets, evaluates rule expressions, presents results, and triggers alerts based on defined conditions. Thanos, on the other hand, is a collection of components designed to create a highly available metric system with limitless storage capacity.
Grafana is designed to visualize data in beautiful dashboards, no matter where the information lives. However, if you are considering the hosted Grafana Cloud observability stack for visualizing your data, you might run into a roadblock: network security. The problem is that some data sources, like MySQL databases or Elasticsearch clusters, are hosted within private networks.