Operations | Monitoring | ITSM | DevOps | Cloud

NestJS - Monitoring your NestJS Application using OpenTelemetry and SigNoz

Monitoring your NestJS application is critical for performance management. But setting up monitoring for NestJS applications can get cumbersome requiring multiple libraries and patterns. That's where OpenTelemetry comes in. In this tutorial, we will use SigNoz as a backend. SigNoz is an open-source APM tool that can be used for both metrics and distributed tracing. Let's get started and see how to use OpenTelemetry for a NestJS application.

Making the World's AWS Bills Less Daunting

Armed with a Ph.D. from UC San Diego, our guest started off with internships at Google and Microsoft before gaining valuable experience as a VP and a highly sought-after consultant for startups and SMBs. Now he’s one of the world’s foremost experts on wrangling vast data sets and maximizing efficiency.

How To Identify and Stop a Phishing Attack

Phishing is a real problem. One that can wreak havoc on your digital and financial life. Here, we’ll look at different ways we can identify a phishing scam and stop it in its tracks. Phishing is the practice of sending emails (or other messages) with the intent to make the recipient believe it’s from a certain company or individual.

Getting Started with OpenTelemetry for Observability

This article was published in The New Stack. For most developers, software development means there is an API for almost everything, hardware is provisioned via the cloud and the core focus is on building only the features most crucial to your business. Of course, all these integrations and modern distributed architectures create their own set of problems. Having full insight into your application has become even more important and is now commonly known as observability.

Cribl.Cloud: Are You Ready to Fly Solo?

Many years ago, I attained my private pilot’s license. This entailed completing a very structured program, similar to how most companies introduce a product to a new user. Let’s be honest, there is a really good reason for this – to avoid the crash and burn. With flight training, it’s literal, while with products it’s a bit more figurative (except when you YOLO something into production–that can cause a crash and burn–and leave for a bad first impression).

Introducing the new and improved Grafana BigQuery plugin

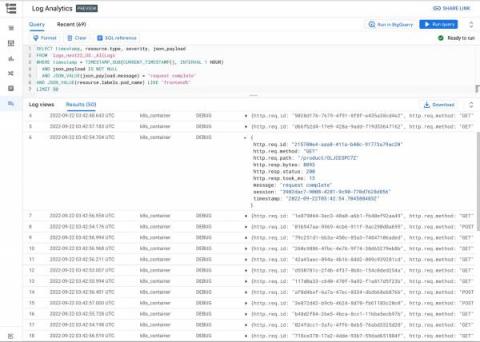
We are happy to announce that an official Google BigQuery data source plugin for Grafana has arrived! Based on the popular DoiT International BigQuery DataSource community plugin, the new Grafana BigQuery plugin brings a new and improved query editor experience plus support for all BigQuery data types, Grafana Alerting, and query caching.

3 Effective Ways to Enhance Patient Safety with EHR Alerts

Hospitals that adopt electronic health records (EHR) to optimize clinical workflows face the decision of how to integrate EHR alerts into their workflows. The rationale is to surface actionable data from EHR systems and present healthcare providers with this information to supplement their day-to-day clinical decisions.

Tech Talk: DevOps Edition - Monitor and Alert on Your Kubernetes Clusters in Seconds

Watch Monitor and Alert on Your Kubernetes Clusters in Seconds to learn how Splunk Observability can help demystify challenges with monitoring distributed microservices. You’ll also view a demonstration on how to correlate application and infrastructure behavior to streamline troubleshooting and alerting on-premises and in the cloud.

Shipa Insights - Engineering Efficiency Release

As we continue to build our vision around Shipa Insights, we are pleased to announce that we are now including engineering efficiency statistics along with the policy and security violations from our initial release. Getting started with Shipa Insights is very easy, Shipa Insights is there for you automatically. Navigate to the Insights Module and take a look at what Shipa has been keeping track of / discovering on your behalf.