Operations | Monitoring | ITSM | DevOps | Cloud
Video: How to build a Prometheus query in Grafana
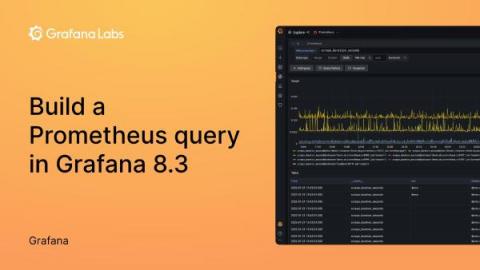
Once you have set up your Prometheus data sources in Grafana, it’s time to put them to work. In the one-minute tutorial video below, we show you how to build a query in Grafana 8.3 with Grafana’s easy-to-use Explore mode. Prometheus uses a query language called PromQL. If you are already familiar with PromQL, you can simply enter your query in the text field and run the query.
How to build a Prometheus query in Grafana
How to add a Prometheus data source in Grafana 8.3
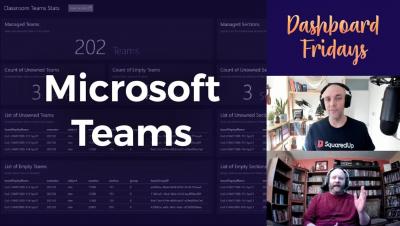
Dashboard Fridays: Sample Microsoft Teams Dashboard
Show it Off with Splunk TV! More Ways to Display Your Best Dashboards
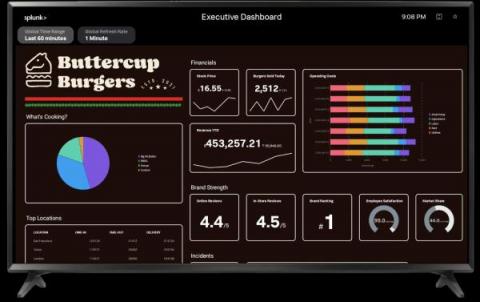
Splunk TV lets you easily display your data on the big screen to visualize and monitor what’s going on in your business. Splunk TV is optimized for a hands-off experience, with slideshows and automatic scrolling so you can display the most important metrics securely and easily. We’re happy to announce that in addition to Classic (Simple XML) dashboards, we now support Studio Dashboards and IT Service Intelligence Glass Tables.
How to Build the Ultimate Database Monitoring Dashboard
Dashboard Fridays: Sample SolarWinds Orion Nodes Dashboard
All about the Grafana Labs Hackathon 2.0
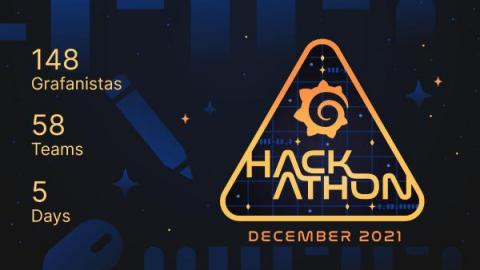
After the success of our first company-wide hackathon last June, we committed to hosting more hackathons each year. So in December, Grafana Labs invited the company to once again press pause on the daily grind and commit five days to our second hackathon. And the Grafanistas showed up: 148 staffers (almost 20% more than the last round) signed on for the week-long event that involved virtual brainstorming, collaborative coding, and creative presentations.
Virtual offsite ideas that work: How the Grafana Cloud team brings together 150 people online
It was a Wednesday in November, and we had just wrapped Grafana Labs' third virtual Grafana Cloud offsite of 2021. Outside my window, it was a dark and cold (8 degrees Celsius) night in Cologne (Köln), Germany. In Austin, Texas, it was early afternoon and headed for 80 degrees Fahrenheit. In Cape Town, South Africa, it was a windy and cool spring evening. And in Melbourne, Australia, our final speaker — who was up very early at 5 a.m. — was heading into a cool spring day.


