Operations | Monitoring | ITSM | DevOps | Cloud




New in Grafana 9.1: Trace to metrics allows users to navigate from a trace span to a selected data source
Traces, logs, and metrics provide inherently different views into a system, which is why correlating between them is important. With features like exemplar support, trace to logs, and span references, you can quickly jump between most telemetry signals in Grafana. With the release of Grafana 9.1, we’re improving Grafana’s ability to correlate different signals by adding the functionality to link between traces and metrics.

New in Grafana 9.1: Share your Grafana dashboard with anyone via public dashboards
We’re excited to announce the launch of a new feature we’ve been working on in Grafana 9.1: public dashboards 🎉. The public dashboards feature will allow you to share your Grafana dashboard with anyone, even if they’re not part of your Grafana organization. Historically, the only way that someone could share a dashboard externally was taking a one-time snapshot 📸, or disabling all authorization for their Grafana instance 😬.
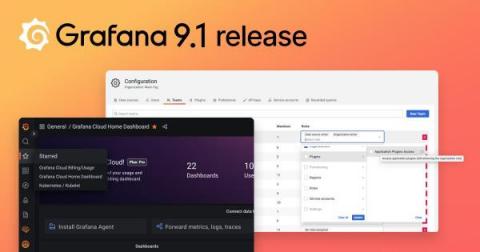
Grafana 9.1 release: New Grafana panels, RBAC for plugins, public dashboards, and more!
Grafana 9.1 is here! Get Grafana 9.1 We’ve made a number of improvements to Grafana’s usability, data visualization, and security. For a full list of new features and capabilities, check out our What’s New in Grafana 9.1 documentation. You can get started with Grafana in minutes with Grafana Cloud. We have a generous free forever tier as well as plans to suit every use case — sign up for free now. Here are some of the highlights in Grafana 9.1.

How Veterans United Home Loans uses Grafana Cloud to help military families become homeowners
Veterans United Home Loans is the top VA lender for home buyers in the United States and has been making the dream of homeownership a reality for veterans and military families for more than two decades. A big part of making that dream come true is keeping their services – including both internal applications and a robust digital experience for their borrowers – highly performant.

Using Grafana and machine learning to analyze microscopy images: Inside Theia Scientific's work
At GrafanaCONline 2022, Theia Scientific President, Managing Member, and Lead Developer Chris Field and Volkov Labs founder and CEO Mikhail Volkov — a Grafana expert — delivered a presentation about using Grafana and machine learning for real-time microscopy image analysis. Real-time microscopy image analysis involves capturing images on a microscope using a digital device such as a PC, iPad, or camera.

Grafana usage insights: How to track who is sending what metrics to your stack in Grafana Cloud
We are happy to announce the release of the Grafana usage groups feature in Grafana Cloud. This new feature — which is available in the Grafana Cloud Advanced plan — helps centralized observability teams and administrators track and attribute metrics usage back to groups that exist within a single shared Grafana stack. Ultimately, Grafana usage groups can help with governance and cost control.

The updated Docker integration in Grafana Cloud now supports logs and metrics
More than 17 million developers use Docker to build, ship, and run applications separate from their infrastructure in order to deliver software faster and more efficiently. With the rising popularity of containerized applications, however, it has become increasingly more complex and difficult to observe and monitor applications running across multiple containers.


Video: How to get started with MongoDB and Grafana
MongoDB is one of the most popular NoSQL databases in the world, used by millions of developers to store application metrics from e-commerce transactions to user logins. The MongoDB Enterprise plugin for Grafana — which is available for users with a Grafana Cloud account or with a Grafana Enterprise license — unlocks all of the data stored in MongoDB as well as diagnostic metrics for monitoring MongoDB itself for visualization, exploration, and alerting.