Operations | Monitoring | ITSM | DevOps | Cloud

Dashboards

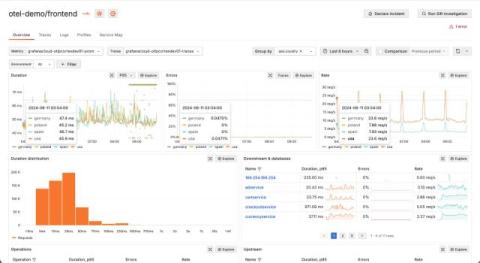
How to use OpenTelemetry resource attributes and Grafana Cloud Application Observability to accelerate root cause analysis

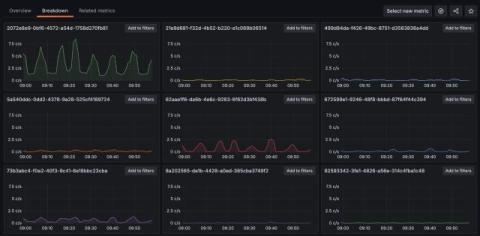
Let’s imagine a scenario: you use OpenTelemetry, and your observability backend runs on several hosts. You collect data on application latency, and notice a recent increase that you want to investigate. But how will you know which host caused the degradation? This is exactly where OpenTelmetry resources come in. In the context of OpenTelemetry, a resource represents the entity producing the telemetry data, such as a container, host, process, service, or operating system.

Introduction to Ingesting OpenTelemetry Logs with Loki | Zero to Hero: Loki | Grafana

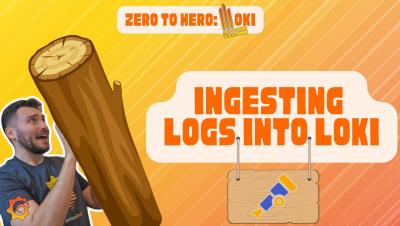
Have you just discovered Grafana Loki and are planning to use OpenTelemetry as your instrumentation tool of choice? Or looking for an introduction to what OpenTelemetry is? In this Zero to Hero episode, we cover the basics of instrumenting your code with the Otel SDK, the Otel Collector and the new native Otel endpoint of Loki.

Curated dashboards in Honeybadger

Earlier this year, we introduced a new logging and performance monitoring tool, Honeybadger Insights. You can finally send your logs, application events, and telemetry data to Honeybadger! Once you do, you can query your logs and events to diagnose performance issues, perform root-cause analyses, and create beautiful charts and dashboards to see what's happening in real time.

How Dell successfully migrated to Grafana Cloud and consolidated its observability in the process

While some monitoring tools excel at a specific task, observability works best when you have a holistic view of your system. You need a platform capable of working with all of your telemetry collectively, otherwise you can end up with a complex, inefficient, and expensive collection of incongruent, siloed tools. That’s what one team at Dell Technologies realized before they made a switch to Grafana Cloud last year.

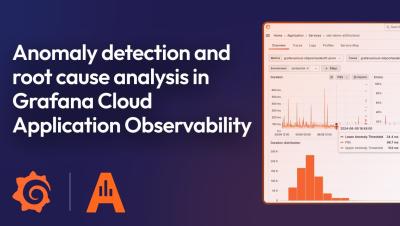
Anomaly detection and root cause analysis with Application Observability | Grafana Cloud

In this video, we walk you through the latest features of Grafana Cloud Application Observability, designed to accelerate anomaly detection and root cause analysis. Application Observability offers an out-of-the-box solution for monitoring applications and minimizing MTTR. It natively supports both OpenTelemetry and Prometheus and allows you to seamlessly unify application and infrastructure insights.

Improved anomaly detection and faster root cause analysis: the latest features in Grafana Cloud Application Observability

In recent years, “the biggest needs we’ve heard from our customers have been to make it easier to understand their observability data, to extend observability into the application layer, and to get deeper, contextualized analytics,” said Tom Wilkie, CTO of Grafana Labs, at ObservabilityCON 2023.

How CEOs Can Have a Bird's Eye View of Their Business While Traveling

The modern era is seeing businesses around the world become increasingly globalized. At the same time, given that remote work has become the norm, CEOs are finding themselves frequently on the move. According to European CEO, CEOs travel from 1 to 10 working days per month for business purposes. In fact, these top-level bosses spend more time traveling than in meetings.

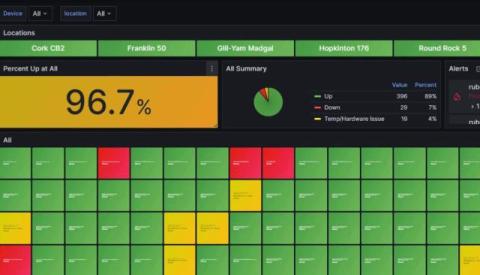
Are dashboards dead? Not quite. They just haven't evolved

In discussions across the tech and data communities in recent years, a provocative idea has been gaining traction: the notion that dashboards are dead. The first time I came across this was in the article by Taylor Brownlow of the same name, "Dashboards are Dead". A worthwhile read. The article suggests that dashboards, as we known them, no longer serve the needs of modern data-driven organizations. Not through their own fault as such, more through misuse or over-asking.