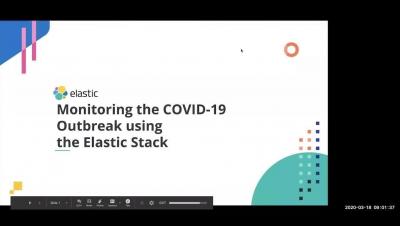
Operations | Monitoring | ITSM | DevOps | Cloud

The ITOA SaaS Platform for Capital Market Data Visualization

If money makes the world go round, then technology is becoming its engine. Financial services, in particular, have widely adopted big data technologies and analytics to inform better investment decisions. The past decade has seen the rise of digital investment platforms. Financial institutions — facing increasing competition, regulatory constraints and customer needs — are seeking ways to leverage technology to gain efficiency and competitive advantage.

Pro Tips: Dashboard Navigation Using Links

Great dashboards answer a limited set of related questions. If you try to answer too many questions in a single dashboard, it can become overly complex. As a consequence, a single dashboard often can’t tell the whole story. So you end up navigating between several, and it can be quite inefficient to search for a particular dashboard every time you need it. Luckily, there are some hacks for navigating between dashboards.

How to Do Automatic Annotations with Grafana and Loki

Grafana annotations are great! They clearly mark the occurrence of an event to help operators and devs correlate events with metrics. You may not be aware of this, but Grafana can automatically annotate graphs by querying Loki. Here’s a look at how to use this feature. Loki queries can be used to automatically generate annotations on Grafana dashboards since 6.4.0. For every log line that is returned from a query, the text is automatically displayed as an annotation at the appropriate time.