Operations | Monitoring | ITSM | DevOps | Cloud

Dashboards

Grafana Agent v0.32 release: New integrations with Oracle, AWS, Microsoft Azure, and more

Grafana Agent v0.32 is now available! This release includes a host of new integrations for the Grafana Agent and components for Grafana Agent Flow so you can easily monitor your vital infrastructure. We’re also excited to announce that Flow is no longer in beta. Introduced last fall, Flow is a new configuration mode that makes Grafana Agent easier and more powerful to run.

AWS Fargate monitoring: How to collect serverless logs, metrics, and traces in Grafana

Interoperability — it’s one of the main reasons I joined Grafana Labs. Our “big tent” philosophy helps Grafana work with a wide range of data sources and tools, and it’s why you can use Grafana to address endless use cases and problems. We are best known for the seamless way we correlate metrics, logs, and traces to understand what is happening in the environment, resolve the immediate issue, and address any underlying issues so that it does not happen again.

New in Grafana Cloud: Key improvements to the command palette and navigation experience

A new navigation experience will be rolled out in Grafana Cloud this month, with improvements designed to make Grafana more seamless to use. Along with updates in Grafana’s search and navigation, there is a new enhanced command palette that helps streamline workflows and allows you to move through the platform without even taking your hands off the keyboard.

5 key takeaways from the Grafana Labs Observability Survey 2023

Observability is coming into its own, as SREs and DevOps practitioners increasingly seek to centralize the sprawl of tools and data sources to better manage their workloads and respond to incidents faster — and to save time and money in the process. That was the overarching message from more than 250 observability practitioners who took part in the Grafana Labs’ first ever Observability Survey.

Write Loki queries easier with Grafana 9.4: Query validation, improved autocomplete, and more

At the beginning of every successful data exploration journey, a query is constructed. So, with this latest Grafana release, we are proud to introduce several new features aimed at improving the Grafana Loki querying experience. From query expression validation to seeing the query history in code editor and more, these updates are sure to make querying in Grafana even more efficient and intuitive, saving you time and frustration.

Grafana Alerting: 12 ways we made creating and managing alerts easier than ever

Since the release of Grafana 9.0, we have been listening to feedback for Grafana Alerting from both our customers and the Grafana community forums. We have heard many of your recommendations, suggestions, and frustrations and have made significant improvements to Grafana Alerting since it became generally available last year. Here at Grafana Labs, we are always striving to improve our product and provide the best possible experience for our users.

First Steps to Building the Ultimate Monitoring Dashboards in Logz.io

Cloud infrastructure and application monitoring dashboards are critical to gaining visibility into the health and performance of your system. But what are the best metrics to monitor? What are the best types of visualizations to monitor them? How can you ensure your alerts are actionable? We answered these questions on our webinar Build the Ultimate Cloud Monitoring Dashboard.

How to optimize resource utilization with Kubernetes Monitoring for Grafana Cloud

Overprovisioning or underprovisioning your Kubernetes resources can have significant consequences on both your budget and your app performance. By underprovisioning your Kubernetes infrastructure, you’ll end up with lagging, underperforming, unstable, or non-functional applications. On the opposite end of the spectrum, overprovisioning is a costly issue: Organizations spent almost $500 billion on cloud resources in 2022, yet an estimated 30% of those were wasted.

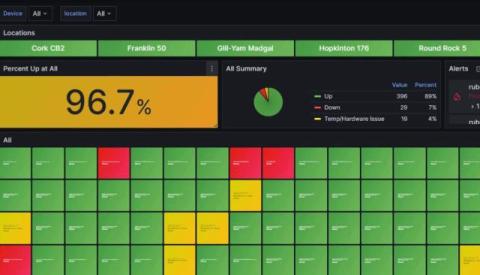
Public Dashboards, Incident Management, and Our New Analytics API

Late last year we announced improvements to our public dashboards that included a revamped dashboard design that allowed users to see monitoring data in a more easily-digestible way, on any device. We improved performance across the board, and also introduced new incident management functionality—available for paid plans only—that allows users to more easily communicate scheduled maintenance notices and alert developers to minor and major incidents.