Troubleshooting a SaaS App in Kentik
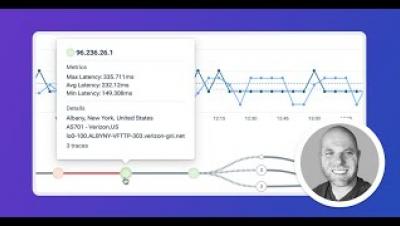
Kentik's Phil Gervasi explains how Kentik's network observability platform helps IT professionals troubleshoot performance problems with SaaS applications. He demonstrates how Kentik's network observability platform can monitor popular SaaS providers, such as Office 365, Salesforce, GitHub, Dropbox, and more, using synthetic testing mechanisms. By capturing metrics like packet loss, latency, DNS resolution, and page load time, Kentik provides valuable insights into SaaS performance. Phil takes you through a real-life example of investigating a poorly performing SaaS application and showcases how Kentik's tools pinpoint network latency issues, both regionally and globally.