Operations | Monitoring | ITSM | DevOps | Cloud

Datadog

Monitor your customer data infrastructure with Segment and Datadog

This is a guest post by Noah Zoschke, Engineering Manager at Segment. Segment is the customer data infrastructure that makes it easy for companies to clean, collect, and control their first-party customer data. At Segment, our ultimate goal is to collect data from Sources (e.g., a website or mobile app) and route it to one or more Destinations (e.g., Google Analytics and AWS Redshift) as quickly and reliably as possible.

Monitor Apache Hive with Datadog

Apache Hive is an open source interface that allows users to query and analyze distributed datasets using SQL commands. Hive compiles SQL commands into an execution plan, which it then runs against your Hadoop deployment. You can customize Hive by using a number of pluggable components (e.g., HDFS and HBase for storage, Spark and MapReduce for execution). With our new integration, you can monitor Hive metrics and logs in context with the rest of your big data infrastructure.

Understand, explore, and collaborate with Dashboard Details

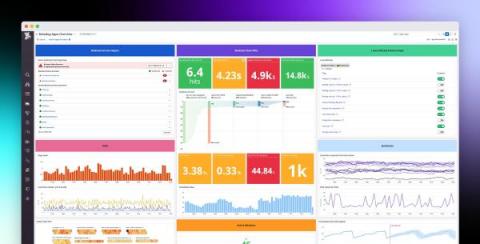
Dashboards provide critical visibility into the performance and health of your environment. But if your organization uses hundreds or thousands of dashboards, or if you’ve recently transitioned to a new company or different team, it’s not always easy to understand the full significance of the data shown on every single dashboard.

How to install Datadog on AWS hosts with Ansible dynamic inventories

Ansible is an automation tool for provisioning, managing, and deploying infrastructure and applications. When building large-scale applications, Ansible enables users to manage and configure their infrastructure across platforms like AWS. Whether you rely on temporary or dedicated hosts, you can use Ansible to create a repeatable process for configuring them with the Datadog Agent.

Monitor Apache Ambari with Datadog

Apache Ambari is an open source management tool that helps organizations operate Hadoop clusters at scale. Ambari provides a web UI and REST API to help users configure, spin up, and monitor Hadoop clusters with one centralized platform. As your Hadoop deployment grows in size and complexity, you need deep visibility into your clusters as well as the Ambari servers that manage them. If issues arise in Ambari, it can lead to problems in your data pipelines and cripple your ability to manage clusters.

Unify logs across data sources with Datadog's customizable naming convention

Log management solutions can make it easy to filter, aggregate, and analyze your log data. Whether you leverage JSON format or process your logs in order to extract attributes, you can slice and dice your logs using the information they provide such as timestamp, HTTP status code, or database user. But different technologies and data sources often label similar information differently, making it difficult to aggregate data across multiple sources.

Monitor JavaScript console logs and user activity with Datadog

Monitoring backend issues is critical for ensuring that requests are handled in a timely manner, and validating that your services are accessible to users. But if you’re not tracking client-side errors and events to get visibility into the frontend, you won’t have any idea how often these issues prompt users to refresh the page—or worse, abandon your website altogether.

Datadog Network Performance Monitoring

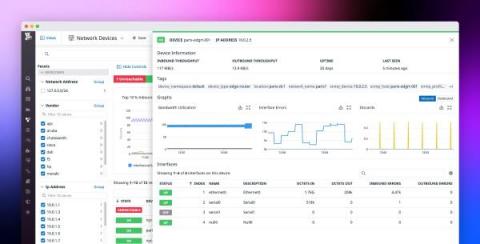
You can now analyze and map network traffic between teams, services, data centers, security groups, or any other subset of your environment. Visualize high-level traffic flows, and drill down in a few clicks to granular details about individual components or services. Network Performance Monitoring is fully integrated with the rest of Datadog, so you can seamlessly pivot to correlated metrics, request traces, and logs for troubleshooting.

Introducing Metrics from Logs and Log Rehydration

As your application grows in size and complexity, it becomes increasingly difficult to manage the number of logs it generates and the cost of ingesting, processing, and analyzing them. Organizations often have little control over fluctuations in the volume of logs generated—and the resulting costs of collecting them—so they are forced to limit the number of logs generated by their applications, or to pre-filter logs before sending them to their log management platform.