Operations | Monitoring | ITSM | DevOps | Cloud
Building & Scaling Distributed Teams
Detect Java code-level issues with Seagence and Datadog
In Java applications, concurrency issues can be difficult to reproduce and debug. Because work is scheduled nondeterministically across threads, the conditions that have led to an error in one execution of the program may not trigger the same issue the next time around. Exceptions that are silently handled—also known as swallowed exceptions—can also be challenging to debug because they typically do not leave any trace in the logs.
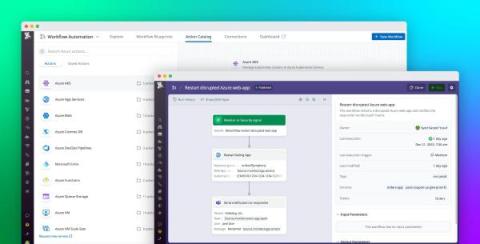
Quickly remediate issues in your Azure applications with Datadog Workflow Automation
Datadog Workflow Automation speeds up incident response and remediation for DevOps, SRE, and security teams by enabling them to automatically run predefined task sequences whenever specific alerts or security signals are triggered. After the feature’s initial release in 2023, Datadog is now excited to announce a significant expansion of its Workflow Automation capabilities with Azure actions, allowing engineers to create automated workflows for their Azure resources for the first time.
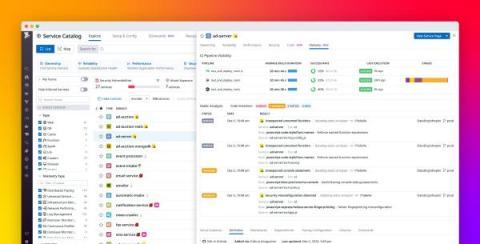
Improve your shift-left observability with the Datadog Service Catalog
Your applications are only as powerful as they are iterable. To keep up with their rapidly changing production environments, your teams need reliable CI/CD systems that implement best practices—including build and test automation, flaky test management, and deployment management. By optimizing their CI/CD pipelines, your teams can build their apps more efficiently, deploy them more safely, and catch bugs and security vulnerabilities before they make it to production.
Why Glovo Chose Database Monitoring to Gain Context for Troubleshooting Issues
How Toyota is using Datadog and AI/ML to invent new ways for humans to be more mobile #datadog
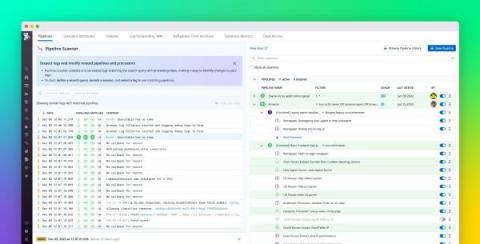
Investigate your log processing with the Datadog Log Pipeline Scanner
Large-scale organizations typically collect and manage millions of logs a day from various services. Within these orgs, many different teams may set up processing pipelines to modify and enrich logs for security monitoring, compliance audits, and DevOps. Datadog Log Pipeline let you ingest logs from your entire stack, parse and enrich them with contextual information, add tags for usage attribution, generate metrics, and quickly identify log anomalies.
Scaling Up, One Network Bottleneck at a Time #shorts #datadog
Monitor Ray applications and clusters with Datadog
Ray is an open source compute framework that simplifies the scaling of AI and Python workloads for on-premise and cloud clusters. Ray integrates with popular libraries, data stores, and tools within the machine learning (ML) ecosystem, including Scikit-learn, PyTorch, and TensorFlow. This gives developers the flexibility to scale complex AI applications without making changes to their existing workflows or AI stack.


